| Red | Green | Blue | |
| z | 17.64 | ||
| znorm | Inf | ||
| sky | -NaN | -Inf | -Inf |
| S/N | 22.4 | 37.3 | 36.7 |
| S/N(c) | 0.0 | 0.0 | 0.0 |
| SN(E/C) |

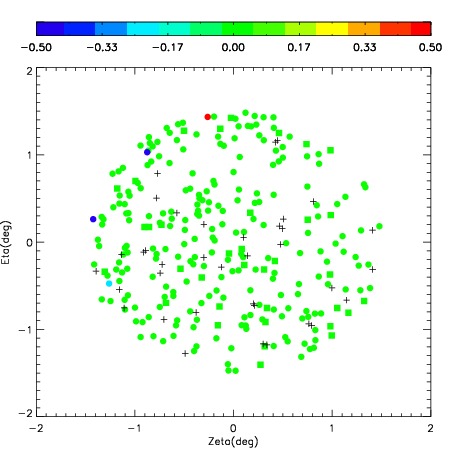
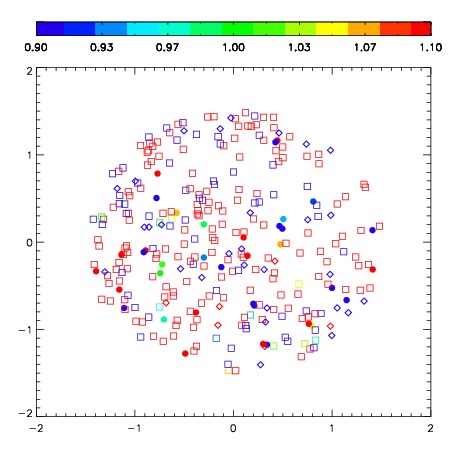
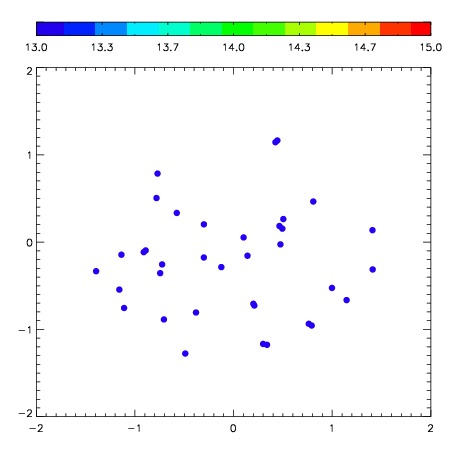
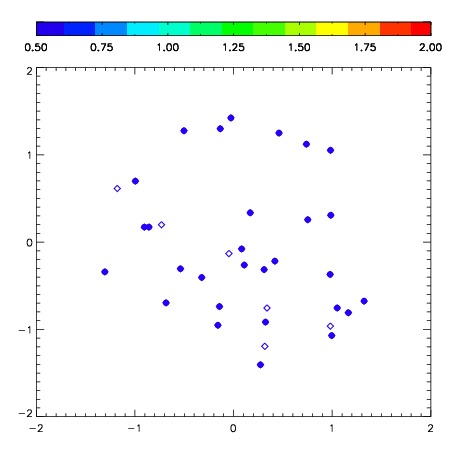
| Frame | Nreads | Zeropoints | Mag plots | Spatial mag deviation | Spatial sky 16325A emission deviations (filled: sky, open: star) | Spatial sky continuum emission | Spatial sky telluric CO2 absorption deviations (filled: H < 10) | |||||||||||||||||||||||
| 0 | 0 |
|
|
|
|
|
|
| IPAIR | NAME | SHIFT | NEWSHIFT | S/N | NAME | SHIFT | NEWSHIFT | S/N |
| 0 | 09100028 | 0.531565 | 0.00000 | 99.0369 | 09100029 | 0.0806639 | 0.450901 | 0.00000 |
| 1 | 09100027 | 0.529534 | 0.00203103 | 112.707 | 09100026 | 0.0934401 | 0.438125 | 107.736 |
| 2 | 09100023 | 0.521519 | 0.0100460 | 107.441 | 09100025 | 0.0917407 | 0.439824 | 106.850 |
| 3 | 09100024 | 0.523559 | 0.00800604 | 100.643 | 09100022 | 0.00000 | 0.531565 | 95.4787 |