| Frame | Nreads | Zeropoints | Mag plots
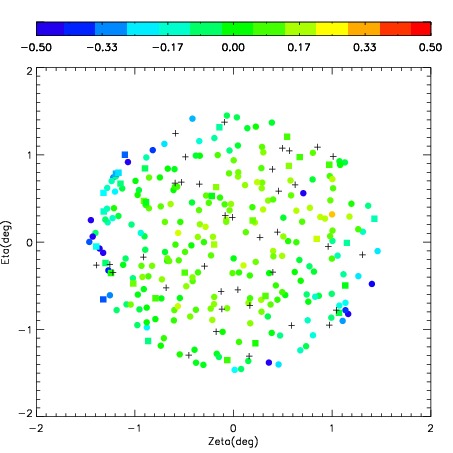
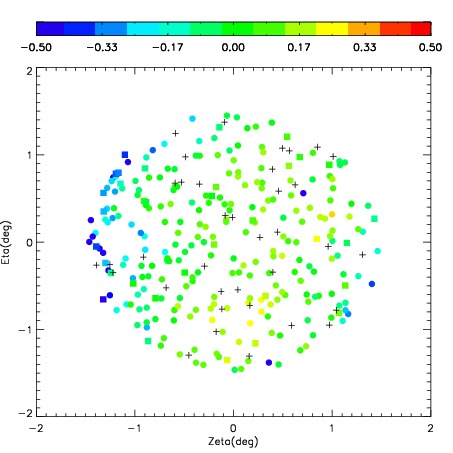
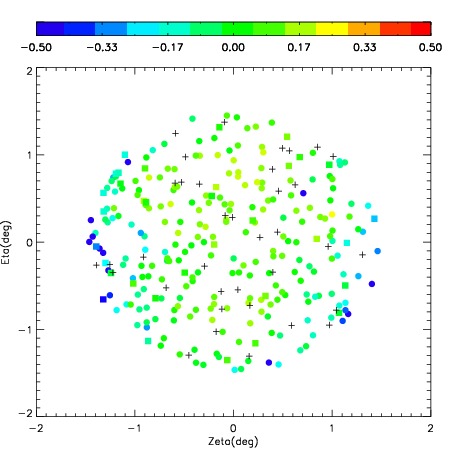
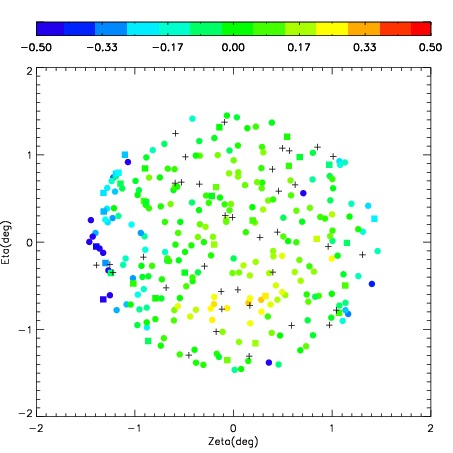
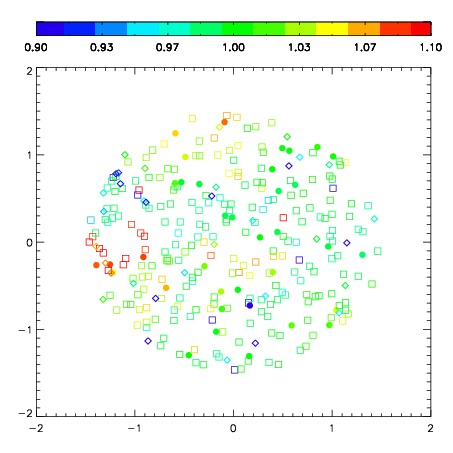
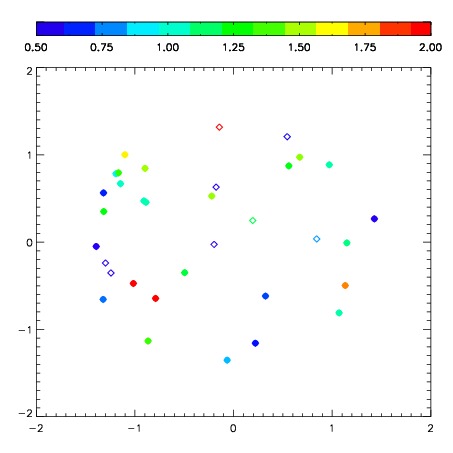
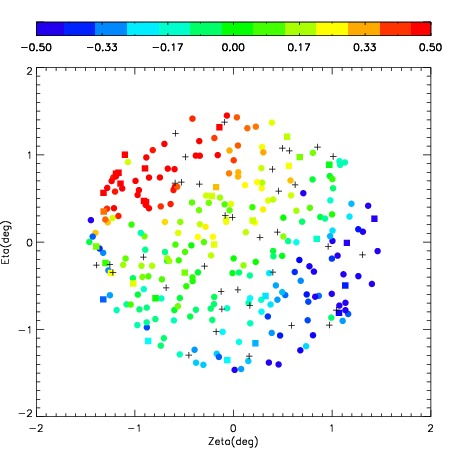
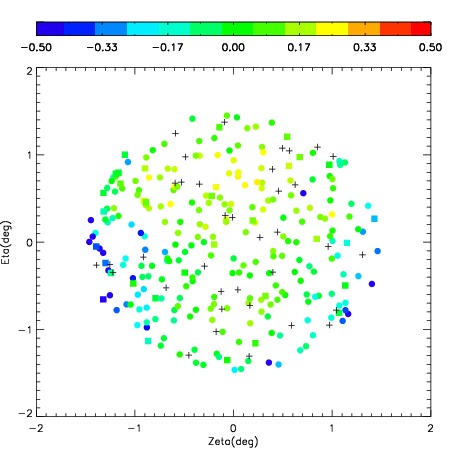
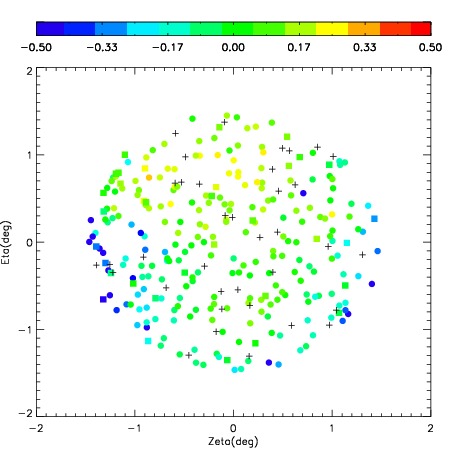
| Spatial mag deviation
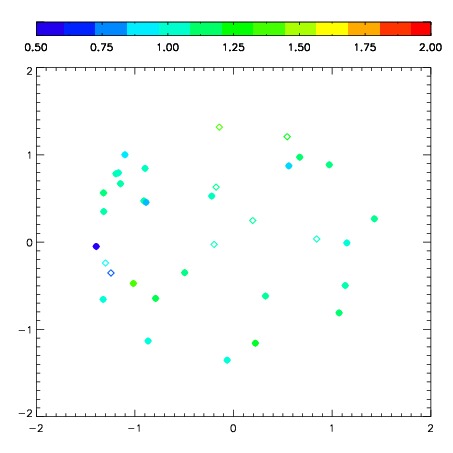
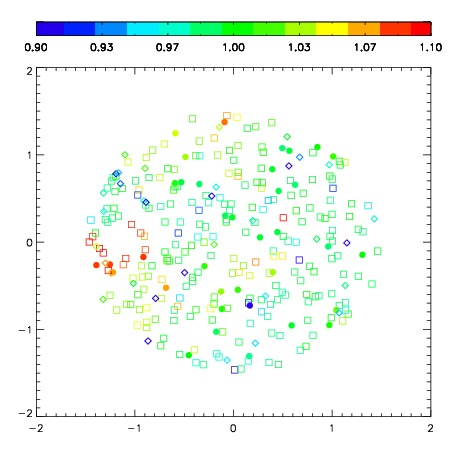
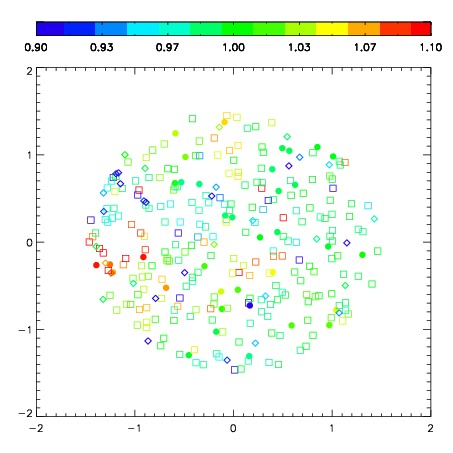
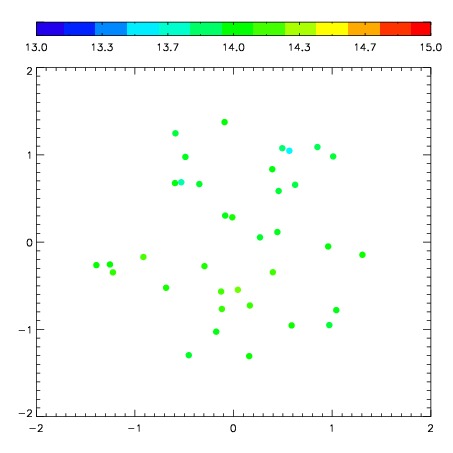
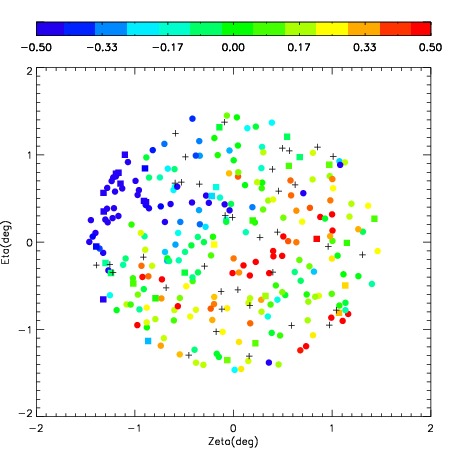
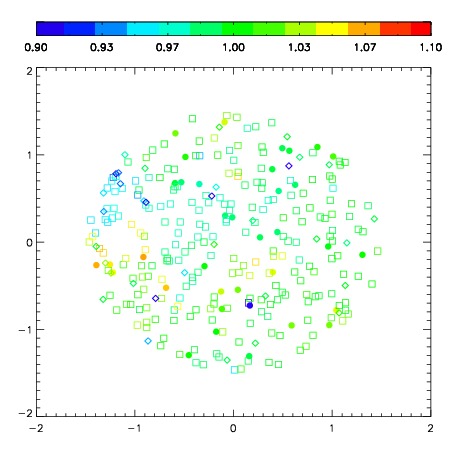
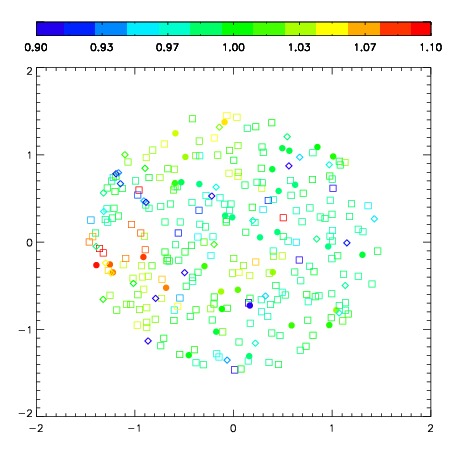
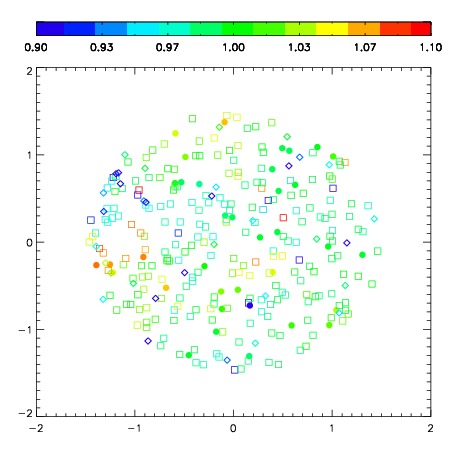
| Spatial sky 16325A emission deviations (filled: sky, open: star)
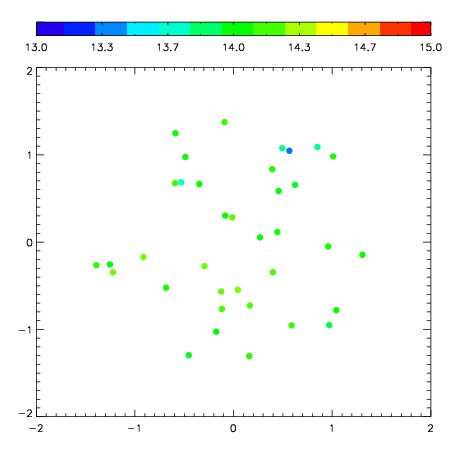
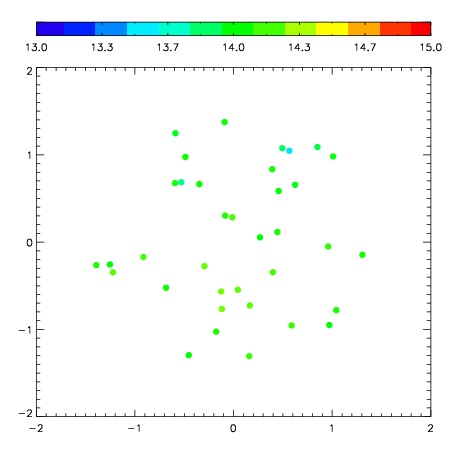
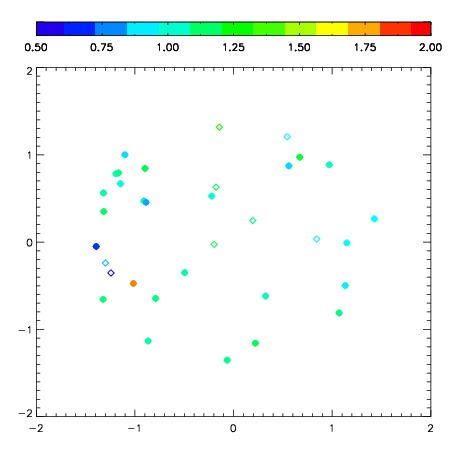
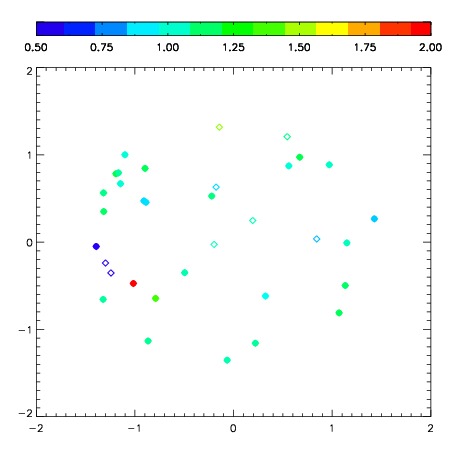
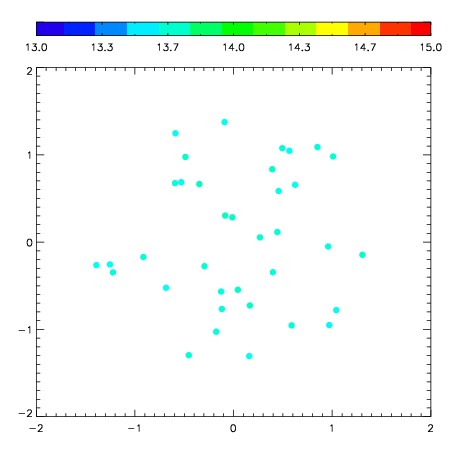
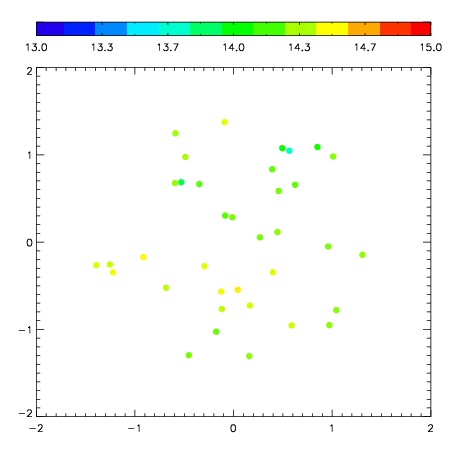
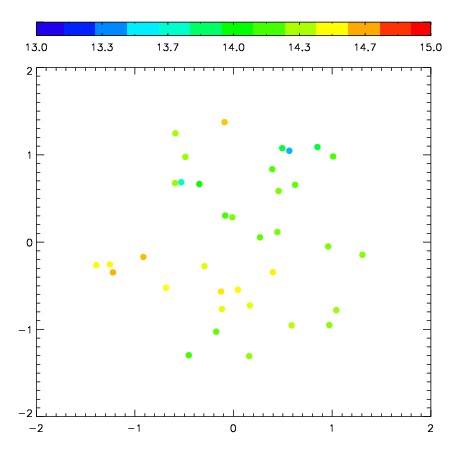
| Spatial sky continuum emission
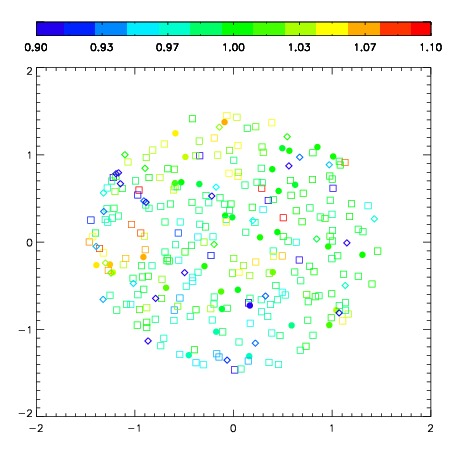
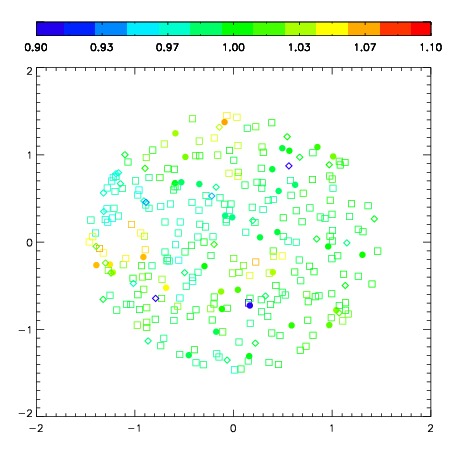
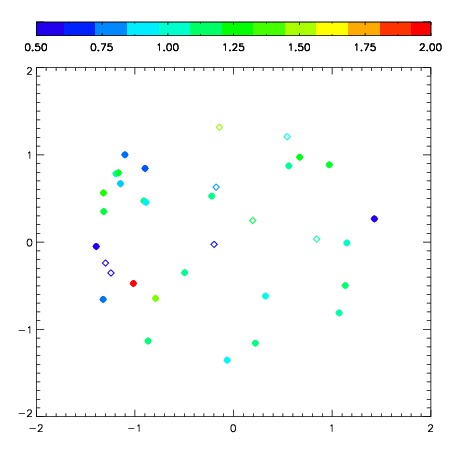
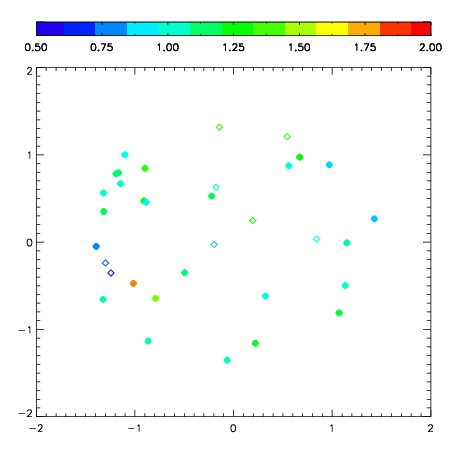
| Spatial sky telluric CO2 absorption deviations (filled: H < 10)
|
| 9100033
| 47
| | Red | Green | Blue
| | z | | 18.71
| | znorm | | 14.53
| | sky | 14.3 | 14.0 | 14.0
| | S/N | 12.4 | 19.5 | 20.1
| | S/N(c) | 11.0 | 18.3 | 18.9
| | SN(E/C) 0.86
|
| 
| 
| 
| 
| 
|
| 9100034
| 47
| | Red | Green | Blue
| | z | | 18.24
| | znorm | | 14.06
| | sky | 14.1 | 14.0 | 14.2
| | S/N | 8.5 | 14.4 | 15.1
| | S/N(c) | 7.5 | 13.1 | 13.5
| | SN(E/C) 0.97
|
| 
| 
| 
| 
| 
|
| 9100035
| 47
| | Red | Green | Blue
| | z | | 18.85
| | znorm | | 14.66
| | sky | 14.4 | 14.2 | 14.2
| | S/N | 13.5 | 20.4 | 21.4
| | S/N(c) | 11.7 | 19.4 | 19.9
| | SN(E/C) 0.86
|
| 
| 
| 
| 
| 
|
| 9100036
| 47
| | Red | Green | Blue
| | z | | 18.04
| | znorm | | 13.86
| | sky | 14.0 | 14.0 | 14.1
| | S/N | 7.0 | 12.1 | 12.6
| | S/N(c) | 6.0 | 10.9 | 11.8
| | SN(E/C) 0.96
|
| 
| 
| 
| 
| 
|
| 9100037
| 47
| | Red | Green | Blue
| | z | | 15.04
| | znorm | | 10.86
| | sky | 13.6 | 13.6 | 13.8
| | S/N | 0.3 | 1.0 | 0.9
| | S/N(c) | 0.4 | 0.9 | 0.9
| | SN(E/C) 0.98
|
| 
| 
| 
| 
| 
|
| 9100038
| 47
| | Red | Green | Blue
| | z | | 16.72
| | znorm | | 12.53
| | sky | 13.9 | 13.8 | 14.1
| | S/N | 2.3 | 4.5 | 5.0
| | S/N(c) | 2.1 | 4.4 | 5.0
| | SN(E/C) 0.99
|
| 
| 
| 
| 
| 
|
| 9100039
| 47
| | Red | Green | Blue
| | z | | 18.23
| | znorm | | 14.05
| | sky | 14.1 | 14.2 | 14.4
| | S/N | 8.6 | 14.5 | 14.6
| | S/N(c) | 7.3 | 13.1 | 13.5
| | SN(E/C) 0.89
|
| 
| 
| 
| 
| 
|
| 9100040
| 47
| | Red | Green | Blue
| | z | | 18.66
| | znorm | | 14.48
| | sky | 14.3 | 14.2 | 14.3
| | S/N | 11.3 | 19.2 | 19.2
| | S/N(c) | 10.1 | 17.3 | 17.6
| | SN(E/C) 0.88
|
| 
| 
| 
| 
| 
|

