| Red | Green | Blue | |
| z | 17.64 | ||
| znorm | Inf | ||
| sky | -Inf | -Inf | -Inf |
| S/N | 26.1 | 44.2 | 48.0 |
| S/N(c) | 0.0 | 0.0 | 0.0 |
| SN(E/C) |

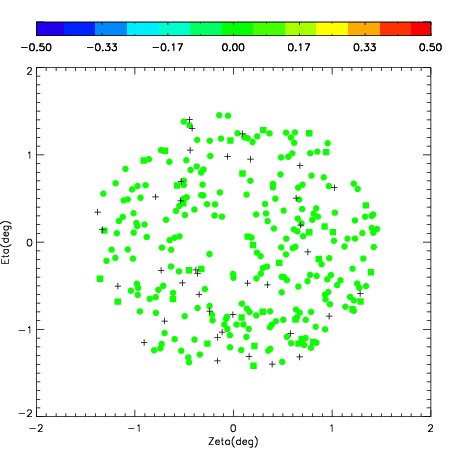
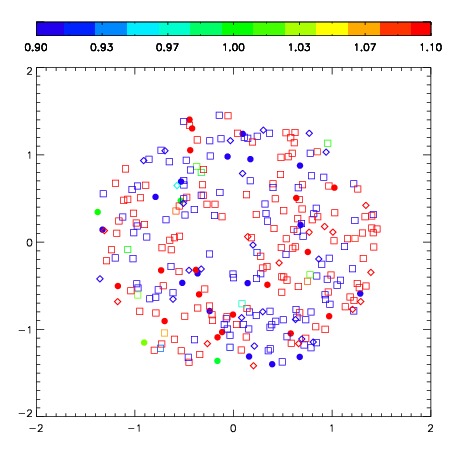


| Frame | Nreads | Zeropoints | Mag plots | Spatial mag deviation | Spatial sky 16325A emission deviations (filled: sky, open: star) | Spatial sky continuum emission | Spatial sky telluric CO2 absorption deviations (filled: H < 10) | |||||||||||||||||||||||
| 0 | 0 |
|
|
|
|
|
|
| IPAIR | NAME | SHIFT | NEWSHIFT | S/N | NAME | SHIFT | NEWSHIFT | S/N |
| 0 | 09050042 | 0.517510 | 0.00000 | 307.493 | 09050039 | 0.0627631 | 0.454747 | 306.425 |
| 1 | 09050041 | 0.515348 | 0.00216198 | 306.816 | 09050043 | 0.0569256 | 0.460584 | 306.119 |
| 2 | 09050038 | 0.511047 | 0.00646299 | 290.531 | 09050040 | 0.0655242 | 0.451986 | 289.429 |
| 3 | 09050037 | 0.511873 | 0.00563699 | 262.563 | 09050036 | 0.00000 | 0.517510 | 271.309 |