| Red | Green | Blue | |
| z | 17.64 | ||
| znorm | Inf | ||
| sky | -Inf | -Inf | -Inf |
| S/N | 29.4 | 49.0 | 53.9 |
| S/N(c) | 0.0 | 0.0 | 0.0 |
| SN(E/C) |


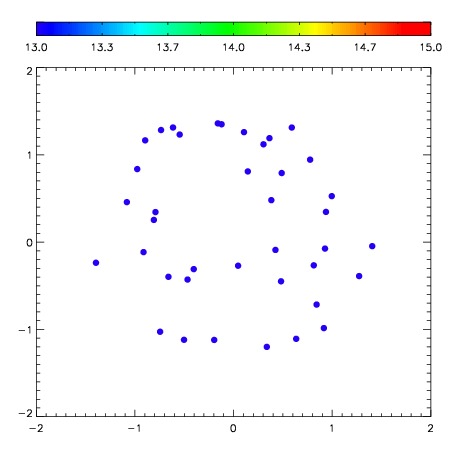
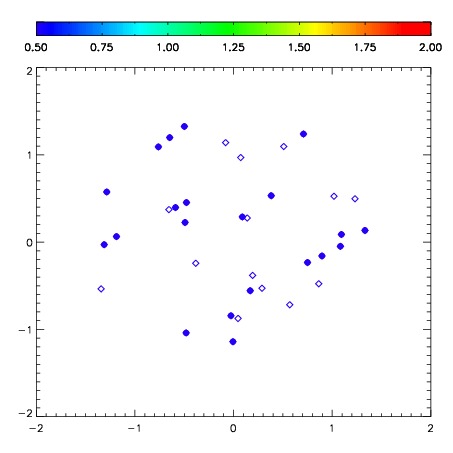
| Frame | Nreads | Zeropoints | Mag plots | Spatial mag deviation | Spatial sky 16325A emission deviations (filled: sky, open: star) | Spatial sky continuum emission | Spatial sky telluric CO2 absorption deviations (filled: H < 10) | |||||||||||||||||||||||
| 0 | 0 |
|
|
|
|
|
|
| IPAIR | NAME | SHIFT | NEWSHIFT | S/N | NAME | SHIFT | NEWSHIFT | S/N |
| 0 | 10210013 | 0.467977 | 0.00000 | 305.522 | 10210011 | 0.00000 | 0.467977 | 303.655 |
| 1 | 10210012 | 0.464430 | 0.00354698 | 306.933 | 10210014 | 0.0386941 | 0.429283 | 305.330 |
| 2 | 10210017 | 0.465619 | 0.00235799 | 303.522 | 10210015 | 0.0394458 | 0.428531 | 303.051 |
| 3 | 10210016 | 0.466205 | 0.00177199 | 298.554 | 10210018 | 0.0373026 | 0.430674 | 301.924 |