| Red | Green | Blue | |
| z | 17.64 | ||
| znorm | Inf | ||
| sky | -Inf | -NaN | -Inf |
| S/N | 23.6 | 39.8 | 45.0 |
| S/N(c) | 0.0 | 0.0 | 0.0 |
| SN(E/C) |


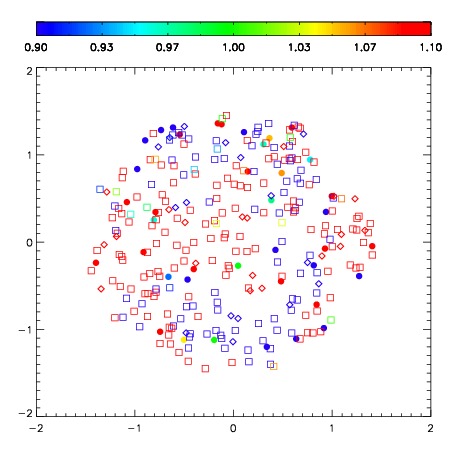
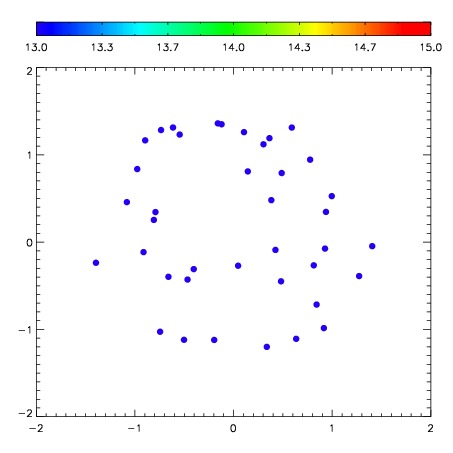
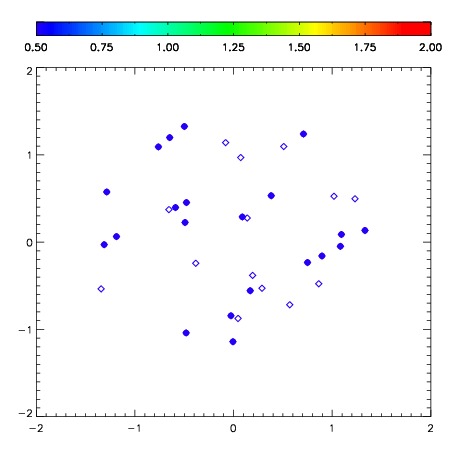
| Frame | Nreads | Zeropoints | Mag plots | Spatial mag deviation | Spatial sky 16325A emission deviations (filled: sky, open: star) | Spatial sky continuum emission | Spatial sky telluric CO2 absorption deviations (filled: H < 10) | |||||||||||||||||||||||
| 0 | 0 |
|
|
|
|
|
|
| IPAIR | NAME | SHIFT | NEWSHIFT | S/N | NAME | SHIFT | NEWSHIFT | S/N |
| 0 | 10250017 | 0.485949 | 0.00000 | 241.628 | 10250014 | 0.0383413 | 0.447608 | 261.354 |
| 1 | 10250012 | 0.467639 | 0.0183100 | 288.508 | 10250011 | 0.00000 | 0.485949 | 291.600 |
| 2 | 10250013 | 0.480213 | 0.00573602 | 257.625 | 10250015 | 0.0385806 | 0.447368 | 268.561 |
| 3 | 10250016 | 0.484581 | 0.00136802 | 253.619 | 10250018 | 0.0377318 | 0.448217 | 261.417 |