| Red | Green | Blue | |
| z | 17.64 | ||
| znorm | Inf | ||
| sky | -NaN | -Inf | -Inf |
| S/N | 25.3 | 44.1 | 49.1 |
| S/N(c) | 0.0 | 0.0 | 0.0 |
| SN(E/C) |

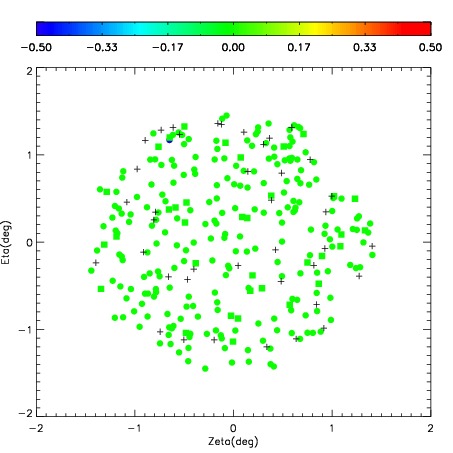
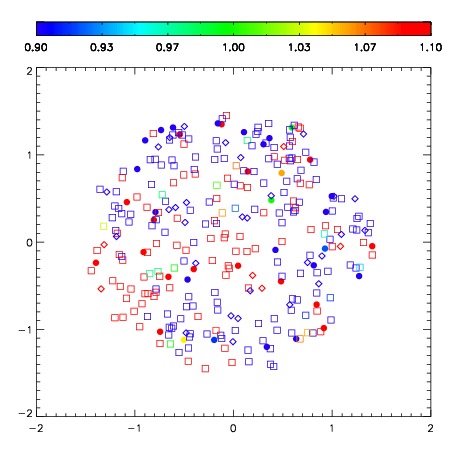
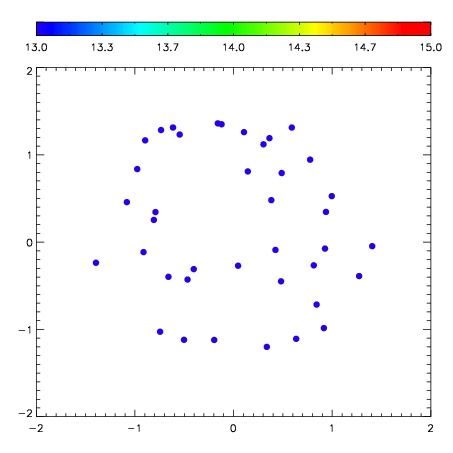
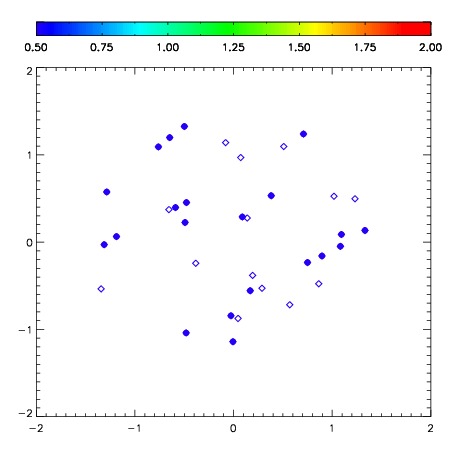
| Frame | Nreads | Zeropoints | Mag plots | Spatial mag deviation | Spatial sky 16325A emission deviations (filled: sky, open: star) | Spatial sky continuum emission | Spatial sky telluric CO2 absorption deviations (filled: H < 10) | |||||||||||||||||||||||
| 0 | 0 |
|
|
|
|
|
|
| IPAIR | NAME | SHIFT | NEWSHIFT | S/N | NAME | SHIFT | NEWSHIFT | S/N |
| 0 | 10490029 | 0.455367 | 0.00000 | 276.087 | 10490031 | 0.0250790 | 0.430288 | 303.391 |
| 1 | 10490033 | 0.440675 | 0.0146920 | 304.999 | 10490028 | 0.00000 | 0.455367 | 305.654 |
| 2 | 10490030 | 0.447253 | 0.00811401 | 303.302 | 10490035 | 0.0228708 | 0.432496 | 304.741 |
| 3 | 10490034 | 0.441810 | 0.0135570 | 300.414 | 10490032 | 0.0232898 | 0.432077 | 304.184 |