| Red | Green | Blue | |
| z | 17.64 | ||
| znorm | Inf | ||
| sky | -Inf | -Inf | -Inf |
| S/N | 26.5 | 43.1 | 45.1 |
| S/N(c) | 0.0 | 0.0 | 0.0 |
| SN(E/C) |


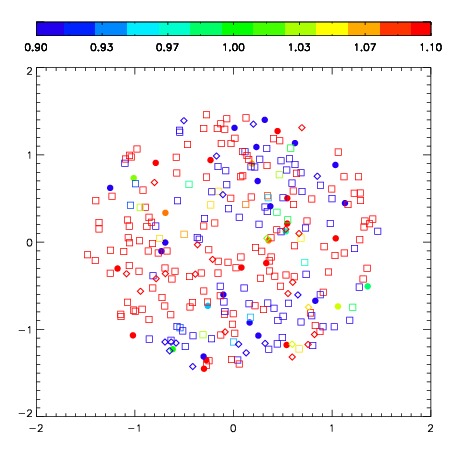
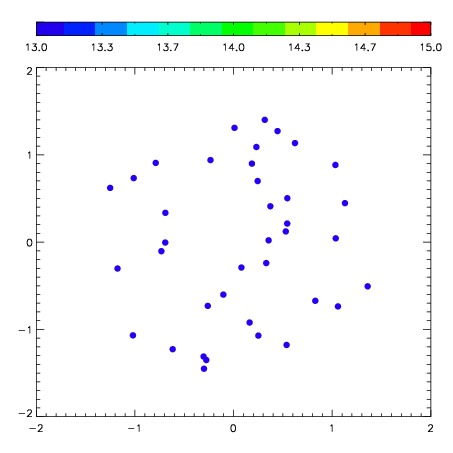
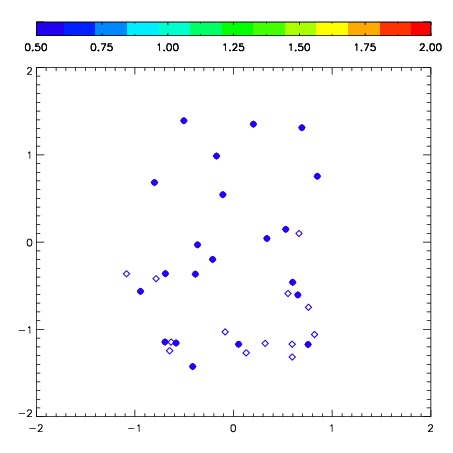
| Frame | Nreads | Zeropoints | Mag plots | Spatial mag deviation | Spatial sky 16325A emission deviations (filled: sky, open: star) | Spatial sky continuum emission | Spatial sky telluric CO2 absorption deviations (filled: H < 10) | |||||||||||||||||||||||
| 0 | 0 |
|
|
|
|
|
|
| IPAIR | NAME | SHIFT | NEWSHIFT | S/N | NAME | SHIFT | NEWSHIFT | S/N |
| 0 | 03340016 | 0.488533 | 0.00000 | 267.558 | 03340017 | 0.0180576 | 0.470475 | 273.922 |
| 1 | 03340015 | 0.483060 | 0.00547299 | 266.413 | 03340013 | 0.0168308 | 0.471702 | 269.311 |
| 2 | 03340011 | 0.481334 | 0.00719899 | 264.536 | 03340010 | 0.00000 | 0.488533 | 263.052 |
| 3 | 03340012 | 0.484611 | 0.00392199 | 263.857 | 03340014 | 0.0146248 | 0.473908 | 253.741 |