| Red | Green | Blue | |
| z | 17.64 | ||
| znorm | Inf | ||
| sky | -Inf | -Inf | -Inf |
| S/N | 26.5 | 43.4 | 45.6 |
| S/N(c) | 0.0 | 0.0 | 0.0 |
| SN(E/C) |

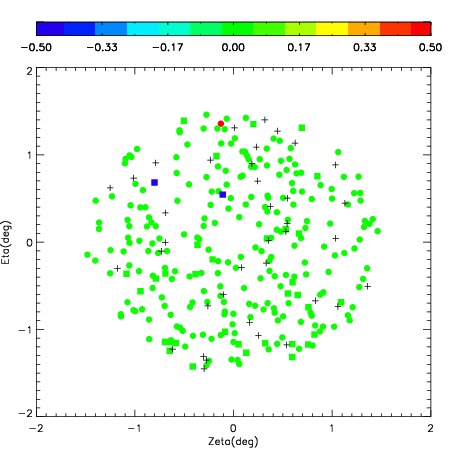
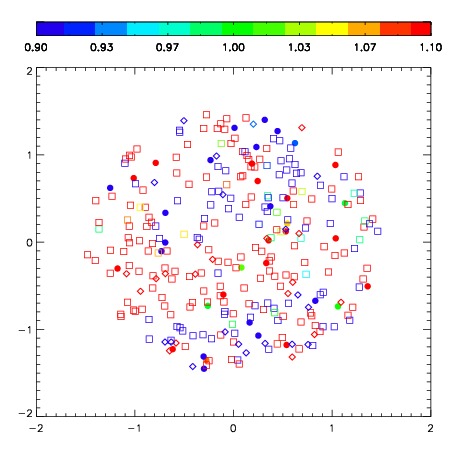
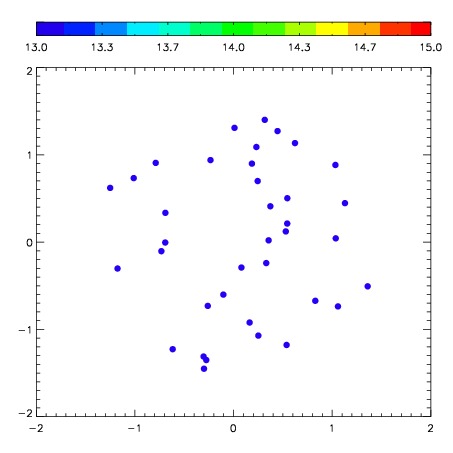
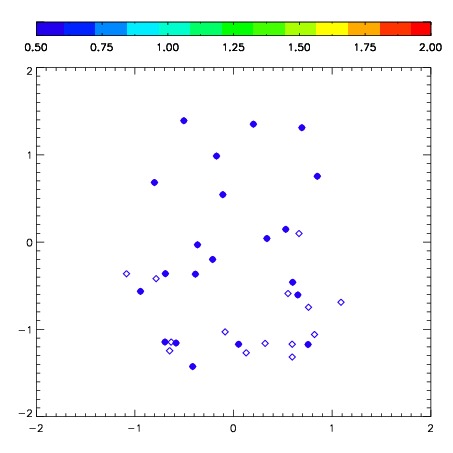
| Frame | Nreads | Zeropoints | Mag plots | Spatial mag deviation | Spatial sky 16325A emission deviations (filled: sky, open: star) | Spatial sky continuum emission | Spatial sky telluric CO2 absorption deviations (filled: H < 10) | |||||||||||||||||||||||
| 0 | 0 |
|
|
|
|
|
|
| IPAIR | NAME | SHIFT | NEWSHIFT | S/N | NAME | SHIFT | NEWSHIFT | S/N |
| 0 | 03410014 | 0.419230 | 0.00000 | 304.893 | 03410015 | -0.0198803 | 0.439110 | 307.701 |
| 1 | 03410010 | 0.417235 | 0.00199503 | 301.492 | 03410011 | -0.0174444 | 0.436674 | 303.640 |
| 2 | 03410013 | 0.415127 | 0.00410300 | 299.327 | 03410012 | -0.0111085 | 0.430339 | 300.281 |
| 3 | 03410009 | 0.411935 | 0.00729501 | 290.212 | 03410008 | 0.00000 | 0.419230 | 165.738 |