| Red | Green | Blue | |
| z | 17.64 | ||
| znorm | Inf | ||
| sky | -Inf | -Inf | -Inf |
| S/N | 20.5 | 35.5 | 37.8 |
| S/N(c) | 0.0 | 0.0 | 0.0 |
| SN(E/C) |


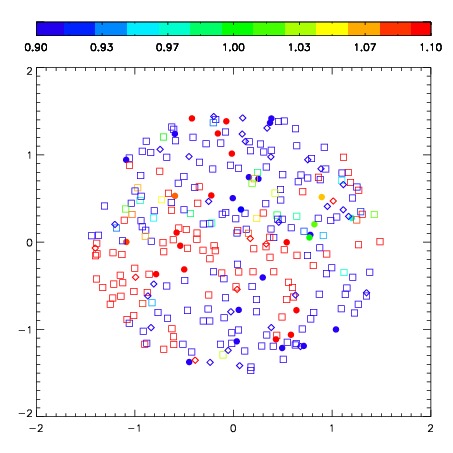


| Frame | Nreads | Zeropoints | Mag plots | Spatial mag deviation | Spatial sky 16325A emission deviations (filled: sky, open: star) | Spatial sky continuum emission | Spatial sky telluric CO2 absorption deviations (filled: H < 10) | |||||||||||||||||||||||
| 0 | 0 |
|
|
|
|
|
|
| IPAIR | NAME | SHIFT | NEWSHIFT | S/N | NAME | SHIFT | NEWSHIFT | S/N |
| 0 | 02820058 | 0.359996 | 0.00000 | 181.059 | 02820057 | 0.00000 | 0.359996 | 176.808 |
| 1 | 02820062 | 0.352405 | 0.00759098 | 205.878 | 02820061 | 0.0123872 | 0.347609 | 207.148 |
| 2 | 02820059 | 0.359797 | 0.000198990 | 198.162 | 02820060 | 0.0139326 | 0.346063 | 203.175 |
| 3 | 02820063 | 0.356766 | 0.00323001 | 195.690 | 02820064 | 0.0166472 | 0.343349 | 202.219 |