| Red | Green | Blue | |
| z | 17.64 | ||
| znorm | Inf | ||
| sky | -NaN | -Inf | -Inf |
| S/N | 24.8 | 41.6 | 46.9 |
| S/N(c) | 0.0 | 0.0 | 0.0 |
| SN(E/C) |
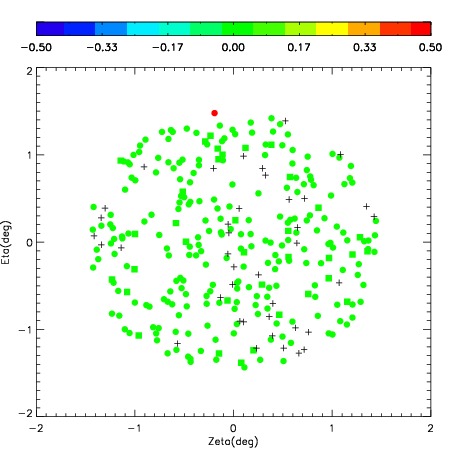
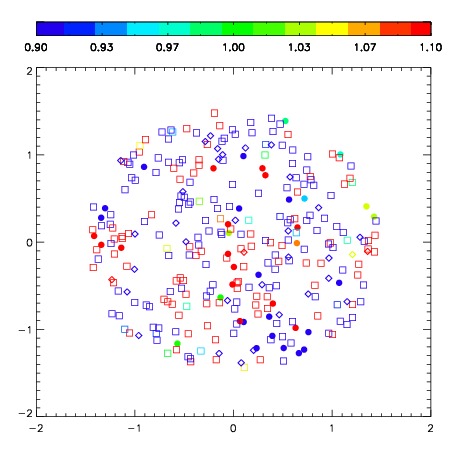


| Frame | Nreads | Zeropoints | Mag plots | Spatial mag deviation | Spatial sky 16325A emission deviations (filled: sky, open: star) | Spatial sky continuum emission | Spatial sky telluric CO2 absorption deviations (filled: H < 10) | |||||||||||||||||||||||
| 0 | 0 |
|
|
|
|
|
|
| IPAIR | NAME | SHIFT | NEWSHIFT | S/N | NAME | SHIFT | NEWSHIFT | S/N |
| 0 | 02890088 | 0.307045 | 0.00000 | 303.980 | 02890090 | -0.00177145 | 0.308816 | 311.521 |
| 1 | 02890092 | 0.299401 | 0.00764403 | 313.624 | 02890091 | -0.00368086 | 0.310726 | 317.841 |
| 2 | 02890089 | 0.302849 | 0.00419602 | 301.300 | 02890087 | -0.00147374 | 0.308519 | 299.910 |
| 3 | 02890085 | 0.305613 | 0.00143200 | 287.933 | 02890086 | -0.00254266 | 0.309588 | 296.855 |
| 4 | 02890084 | 0.303135 | 0.00391001 | 281.661 | 02890083 | 0.00000 | 0.307045 | 290.397 |