| Red | Green | Blue | |
| z | 17.64 | ||
| znorm | Inf | ||
| sky | -Inf | -NaN | -Inf |
| S/N | 28.7 | 47.0 | 53.5 |
| S/N(c) | 0.0 | 0.0 | 0.0 |
| SN(E/C) |

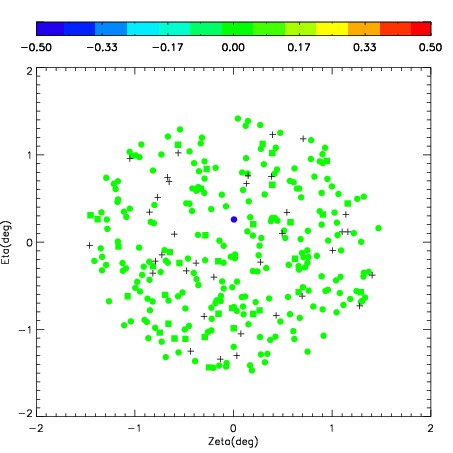
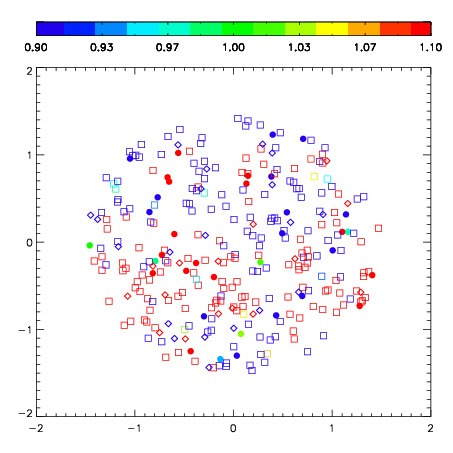

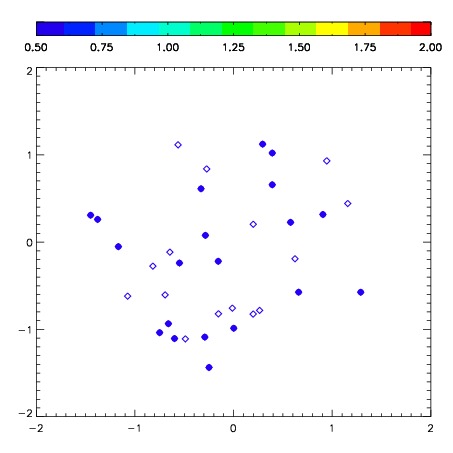
| Frame | Nreads | Zeropoints | Mag plots | Spatial mag deviation | Spatial sky 16325A emission deviations (filled: sky, open: star) | Spatial sky continuum emission | Spatial sky telluric CO2 absorption deviations (filled: H < 10) | |||||||||||||||||||||||
| 0 | 0 |
|
|
|
|
|
|
| IPAIR | NAME | SHIFT | NEWSHIFT | S/N | NAME | SHIFT | NEWSHIFT | S/N |
| 0 | 03710070 | 0.350902 | 0.00000 | 292.784 | 03710072 | -0.0451094 | 0.396011 | 291.260 |
| 1 | 03710067 | 0.339665 | 0.0112370 | 301.501 | 03710065 | 0.00000 | 0.350902 | 298.820 |
| 2 | 03710066 | 0.333867 | 0.0170350 | 299.620 | 03710068 | -0.0372586 | 0.388161 | 297.907 |
| 3 | 03710071 | 0.348030 | 0.00287199 | 295.346 | 03710069 | -0.0387317 | 0.389634 | 296.904 |