| Red | Green | Blue | |
| z | 17.64 | ||
| znorm | Inf | ||
| sky | -NaN | -NaN | -Inf |
| S/N | 27.0 | 43.6 | 48.8 |
| S/N(c) | 0.0 | 0.0 | 0.0 |
| SN(E/C) |
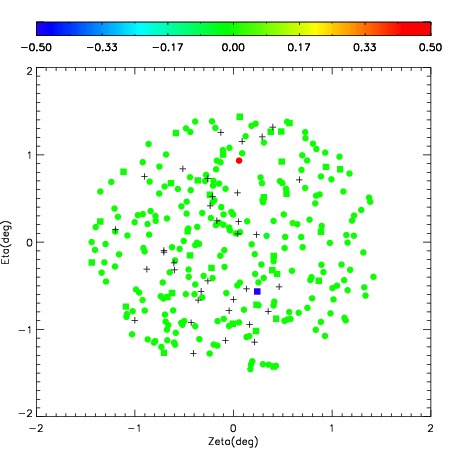
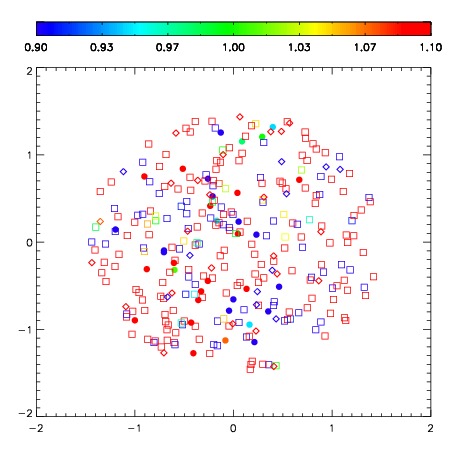
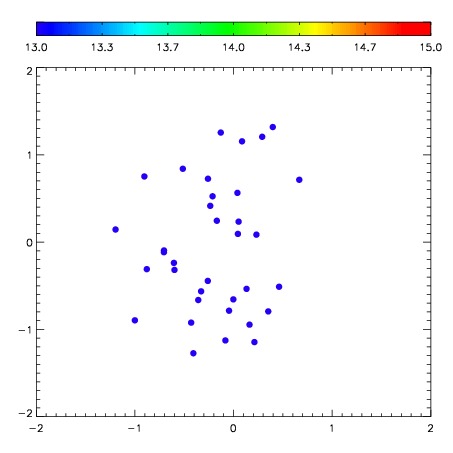

| Frame | Nreads | Zeropoints | Mag plots | Spatial mag deviation | Spatial sky 16325A emission deviations (filled: sky, open: star) | Spatial sky continuum emission | Spatial sky telluric CO2 absorption deviations (filled: H < 10) | |||||||||||||||||||||||
| 0 | 0 |
|
|
|
|
|
|
| IPAIR | NAME | SHIFT | NEWSHIFT | S/N | NAME | SHIFT | NEWSHIFT | S/N |
| 0 | 10430017 | 0.534849 | 0.00000 | 238.432 | 10430011 | 0.00000 | 0.534849 | 241.707 |
| 1 | 10430016 | 0.524864 | 0.00998497 | 240.688 | 10430015 | 0.0403985 | 0.494450 | 246.215 |
| 2 | 10430012 | 0.520151 | 0.0146980 | 234.158 | 10430018 | 0.0506766 | 0.484172 | 240.167 |
| 3 | 10430013 | 0.526475 | 0.00837398 | 230.411 | 10430014 | 0.0355443 | 0.499305 | 235.481 |