| Red | Green | Blue | |
| z | 17.64 | ||
| znorm | Inf | ||
| sky | -NaN | -Inf | -Inf |
| S/N | 29.3 | 50.0 | 55.0 |
| S/N(c) | 0.0 | 0.0 | 0.0 |
| SN(E/C) |
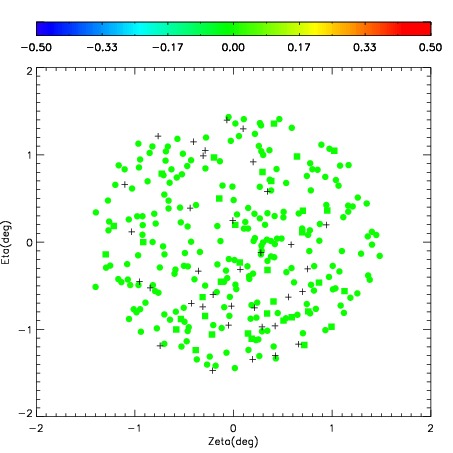
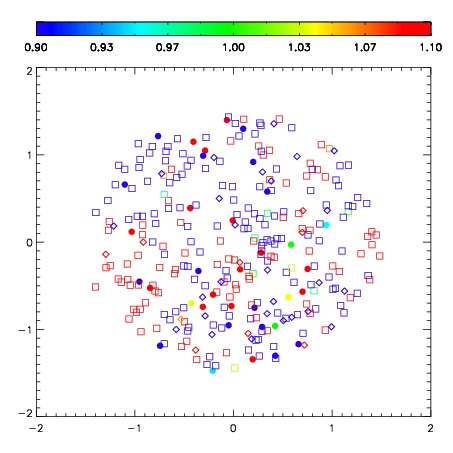
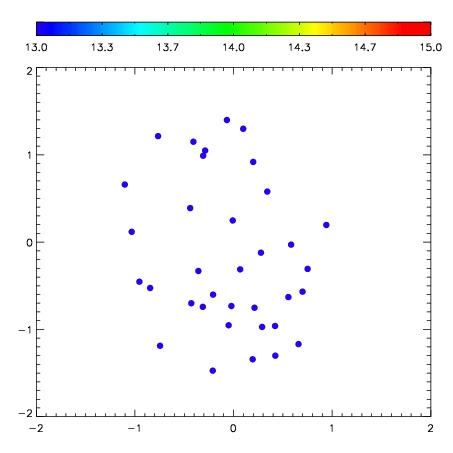
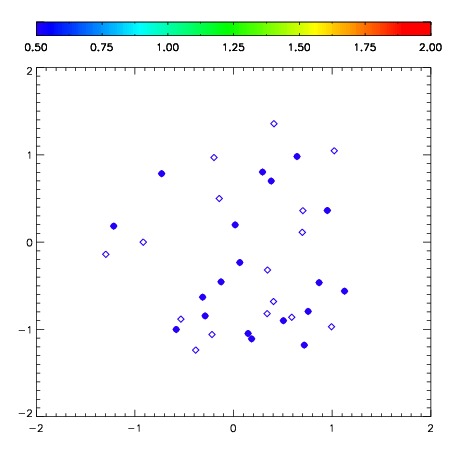
| Frame | Nreads | Zeropoints | Mag plots | Spatial mag deviation | Spatial sky 16325A emission deviations (filled: sky, open: star) | Spatial sky continuum emission | Spatial sky telluric CO2 absorption deviations (filled: H < 10) | |||||||||||||||||||||||
| 0 | 0 |
|
|
|
|
|
|
| IPAIR | NAME | SHIFT | NEWSHIFT | S/N | NAME | SHIFT | NEWSHIFT | S/N |
| 0 | 10250039 | 0.483312 | 0.00000 | 249.370 | 10250040 | 0.0667413 | 0.416571 | 253.685 |
| 1 | 10250038 | 0.469078 | 0.0142340 | 256.585 | 10250037 | 0.00000 | 0.483312 | 257.439 |
| 2 | 10250042 | 0.477434 | 0.00587800 | 237.657 | 10250041 | 0.0618014 | 0.421511 | 248.739 |
| 3 | 10250043 | 0.482326 | 0.000986010 | 235.034 | 10250044 | 0.0624566 | 0.420855 | 239.067 |