| Red | Green | Blue | |
| z | 17.64 | ||
| znorm | Inf | ||
| sky | -NaN | -Inf | -Inf |
| S/N | 28.8 | 47.6 | 52.4 |
| S/N(c) | 0.0 | 0.0 | 0.0 |
| SN(E/C) |
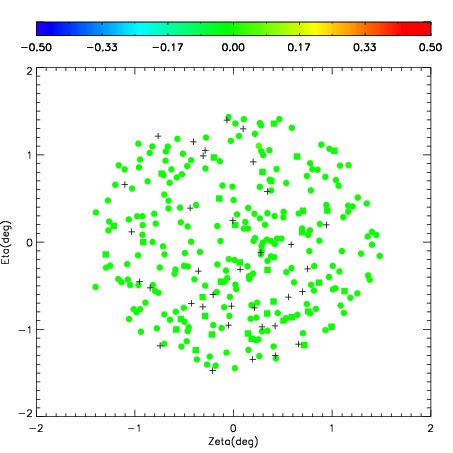
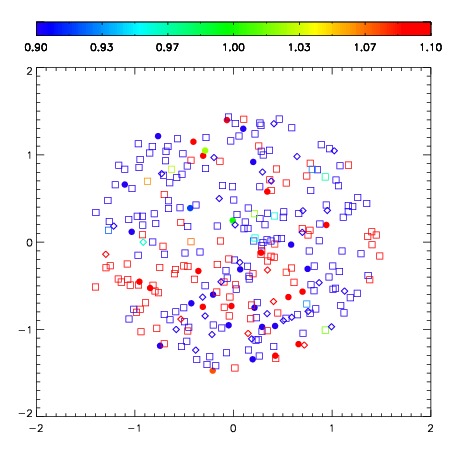


| Frame | Nreads | Zeropoints | Mag plots | Spatial mag deviation | Spatial sky 16325A emission deviations (filled: sky, open: star) | Spatial sky continuum emission | Spatial sky telluric CO2 absorption deviations (filled: H < 10) | |||||||||||||||||||||||
| 0 | 0 |
|
|
|
|
|
|
| IPAIR | NAME | SHIFT | NEWSHIFT | S/N | NAME | SHIFT | NEWSHIFT | S/N |
| 0 | 10430034 | 0.413668 | 0.00000 | 272.284 | 10430033 | 0.00000 | 0.413668 | 268.456 |
| 1 | 10430035 | 0.405161 | 0.00850701 | 272.760 | 10430036 | 0.0393011 | 0.374367 | 271.619 |
| 2 | 10430039 | 0.410382 | 0.00328600 | 271.960 | 10430037 | 0.0394342 | 0.374234 | 265.960 |
| 3 | 10430038 | 0.404712 | 0.00895602 | 269.150 | 10430040 | 0.0384590 | 0.375209 | 260.886 |