| Red | Green | Blue | |
| z | 17.64 | ||
| znorm | Inf | ||
| sky | -Inf | -Inf | -Inf |
| S/N | 16.6 | 28.8 | 31.4 |
| S/N(c) | 0.0 | 0.0 | 0.0 |
| SN(E/C) |


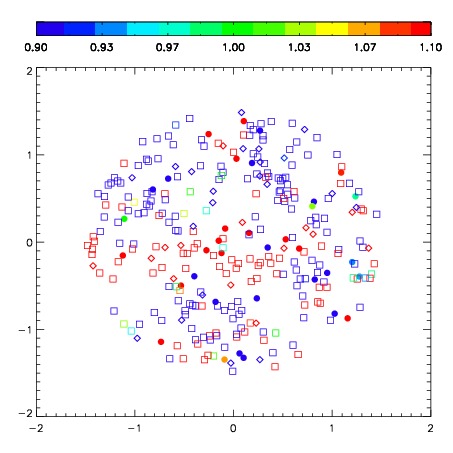

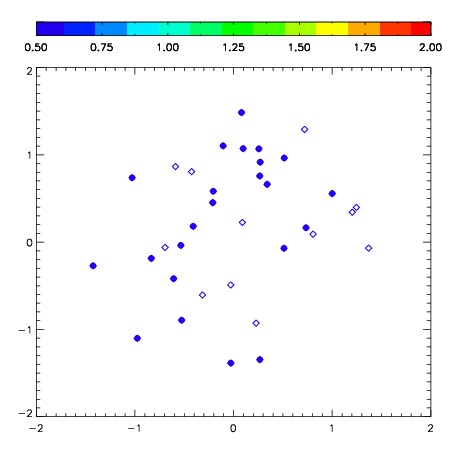
| Frame | Nreads | Zeropoints | Mag plots | Spatial mag deviation | Spatial sky 16325A emission deviations (filled: sky, open: star) | Spatial sky continuum emission | Spatial sky telluric CO2 absorption deviations (filled: H < 10) | |||||||||||||||||||||||
| 0 | 0 |
|
|
|
|
|
|
| IPAIR | NAME | SHIFT | NEWSHIFT | S/N | NAME | SHIFT | NEWSHIFT | S/N |
| 0 | 02810039 | 0.258584 | 0.00000 | 233.415 | 02810042 | -0.0123744 | 0.270958 | 248.231 |
| 1 | 02810044 | 0.252825 | 0.00575900 | 244.184 | 02810038 | 0.00000 | 0.258584 | 264.069 |
| 2 | 02810040 | 0.258094 | 0.000489980 | 237.992 | 02810045 | -0.00876896 | 0.267353 | 256.765 |
| 3 | 02810043 | 0.253881 | 0.00470299 | 235.297 | 02810041 | -0.0135645 | 0.272148 | 253.690 |