| Red | Green | Blue | |
| z | 17.64 | ||
| znorm | Inf | ||
| sky | -NaN | -Inf | -Inf |
| S/N | 20.6 | 32.5 | 36.3 |
| S/N(c) | 0.0 | 0.0 | 0.0 |
| SN(E/C) |


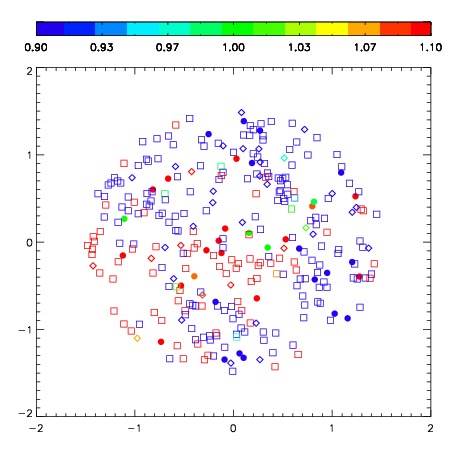


| Frame | Nreads | Zeropoints | Mag plots | Spatial mag deviation | Spatial sky 16325A emission deviations (filled: sky, open: star) | Spatial sky continuum emission | Spatial sky telluric CO2 absorption deviations (filled: H < 10) | |||||||||||||||||||||||
| 0 | 0 |
|
|
|
|
|
|
| IPAIR | NAME | SHIFT | NEWSHIFT | S/N | NAME | SHIFT | NEWSHIFT | S/N |
| 0 | 02880066 | 0.262587 | 0.00000 | 261.415 | 02880067 | -0.00926071 | 0.271848 | 252.735 |
| 1 | 02880061 | 0.251453 | 0.0111340 | 280.352 | 02880060 | 0.00000 | 0.262587 | 282.208 |
| 2 | 02880065 | 0.258391 | 0.00419602 | 264.895 | 02880063 | -0.0118610 | 0.274448 | 262.930 |
| 3 | 02880062 | 0.256355 | 0.00623202 | 262.368 | 02880064 | -0.00974794 | 0.272335 | 259.093 |