| Red | Green | Blue | |
| z | 17.64 | ||
| znorm | Inf | ||
| sky | -Inf | -Inf | -Inf |
| S/N | 22.7 | 38.2 | 43.0 |
| S/N(c) | 0.0 | 0.0 | 0.0 |
| SN(E/C) |
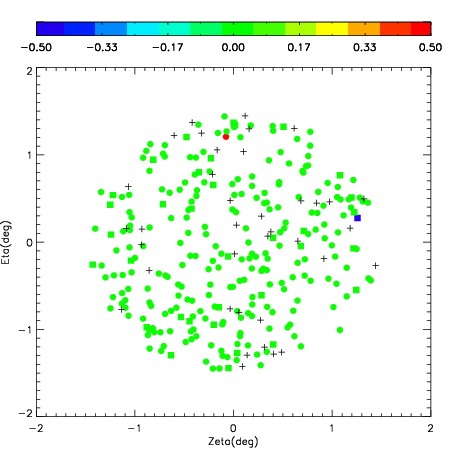
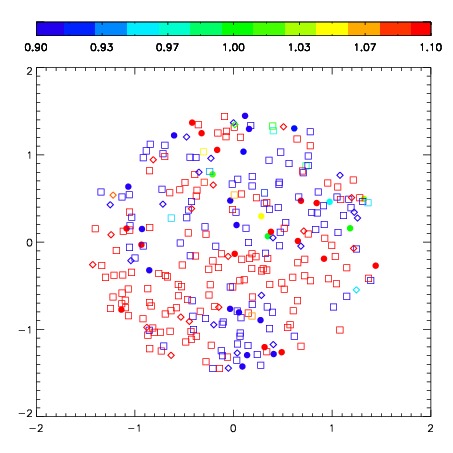
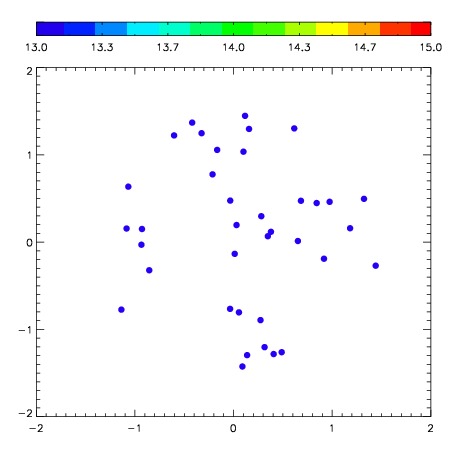
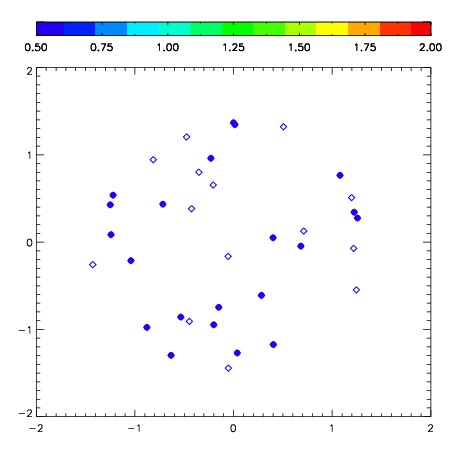
| Frame | Nreads | Zeropoints | Mag plots | Spatial mag deviation | Spatial sky 16325A emission deviations (filled: sky, open: star) | Spatial sky continuum emission | Spatial sky telluric CO2 absorption deviations (filled: H < 10) | |||||||||||||||||||||||
| 0 | 0 |
|
|
|
|
|
|
| IPAIR | NAME | SHIFT | NEWSHIFT | S/N | NAME | SHIFT | NEWSHIFT | S/N |
| 0 | 04050027 | 0.404562 | 0.00000 | 231.054 | 04050025 | 0.00000 | 0.404562 | 243.497 |
| 1 | 04050031 | 0.386171 | 0.0183910 | 271.405 | 04050032 | -0.00543487 | 0.409997 | 268.040 |
| 2 | 04050030 | 0.390112 | 0.0144500 | 261.407 | 04050028 | -0.00427490 | 0.408837 | 258.291 |
| 3 | 04050026 | 0.398708 | 0.00585401 | 237.495 | 04050029 | -0.00631817 | 0.410880 | 246.266 |