| Red | Green | Blue | |
| z | 17.64 | ||
| znorm | Inf | ||
| sky | -Inf | -Inf | -Inf |
| S/N | 24.5 | 38.7 | 41.2 |
| S/N(c) | 0.0 | 0.0 | 0.0 |
| SN(E/C) |

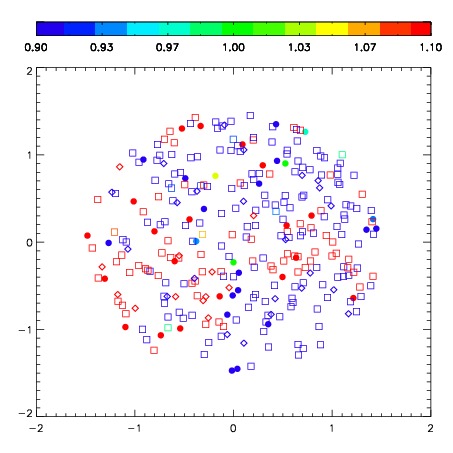


| Frame | Nreads | Zeropoints | Mag plots | Spatial mag deviation | Spatial sky 16325A emission deviations (filled: sky, open: star) | Spatial sky continuum emission | Spatial sky telluric CO2 absorption deviations (filled: H < 10) | |||||||||||||||||||||||
| 0 | 0 |
|
|
|
|
|
|
| IPAIR | NAME | SHIFT | NEWSHIFT | S/N | NAME | SHIFT | NEWSHIFT | S/N |
| 0 | 02850014 | 0.277255 | 0.00000 | 290.671 | 02850012 | 0.00000 | 0.277255 | 289.961 |
| 1 | 02850018 | 0.276232 | 0.00102299 | 296.935 | 02850019 | -0.0287711 | 0.306026 | 298.982 |
| 2 | 02850017 | 0.269633 | 0.00762200 | 294.172 | 02850016 | -0.0241773 | 0.301432 | 293.123 |
| 3 | 02850013 | 0.274350 | 0.00290501 | 291.629 | 02850015 | -0.0238759 | 0.301131 | 293.050 |