| Red | Green | Blue | |
| z | 17.64 | ||
| znorm | Inf | ||
| sky | -Inf | -Inf | -Inf |
| S/N | 14.5 | 25.4 | 28.1 |
| S/N(c) | 0.0 | 0.0 | 0.0 |
| SN(E/C) |

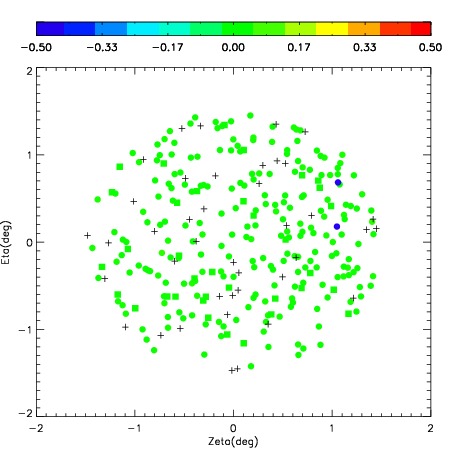
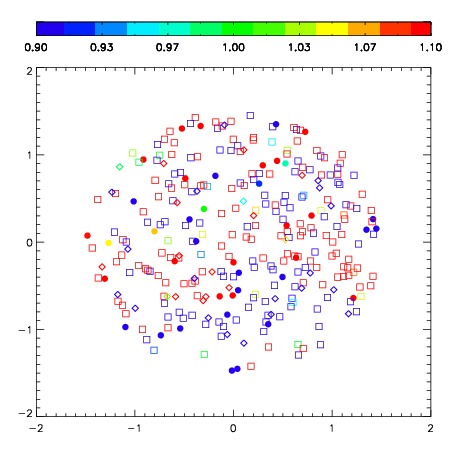

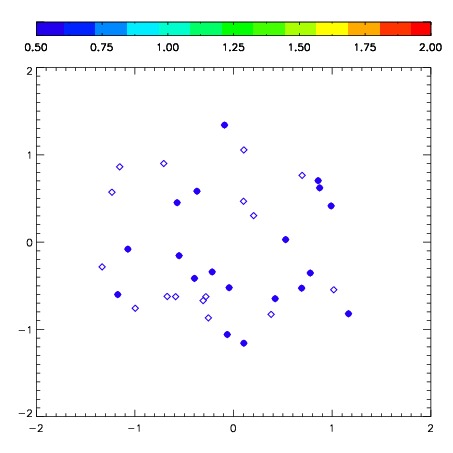
| Frame | Nreads | Zeropoints | Mag plots | Spatial mag deviation | Spatial sky 16325A emission deviations (filled: sky, open: star) | Spatial sky continuum emission | Spatial sky telluric CO2 absorption deviations (filled: H < 10) | |||||||||||||||||||||||
| 0 | 0 |
|
|
|
|
|
|
| IPAIR | NAME | SHIFT | NEWSHIFT | S/N | NAME | SHIFT | NEWSHIFT | S/N |
| 0 | 04010010 | 0.380271 | 0.00000 | 148.016 | 04010012 | -0.0215248 | 0.401796 | 184.068 |
| 1 | 04010014 | 0.363884 | 0.0163870 | 195.677 | 04010008 | 0.00000 | 0.380271 | 281.010 |
| 2 | 04010013 | 0.366766 | 0.0135050 | 192.288 | 04010015 | -0.0173402 | 0.397611 | 186.118 |
| 3 | 04010009 | 0.357555 | 0.0227160 | 0.00000 | 04010011 | -0.0208727 | 0.401144 | 140.399 |