| Red | Green | Blue | |
| z | 17.64 | ||
| znorm | Inf | ||
| sky | -NaN | -Inf | -Inf |
| S/N | 29.3 | 49.0 | 53.2 |
| S/N(c) | 0.0 | 0.0 | 0.0 |
| SN(E/C) |

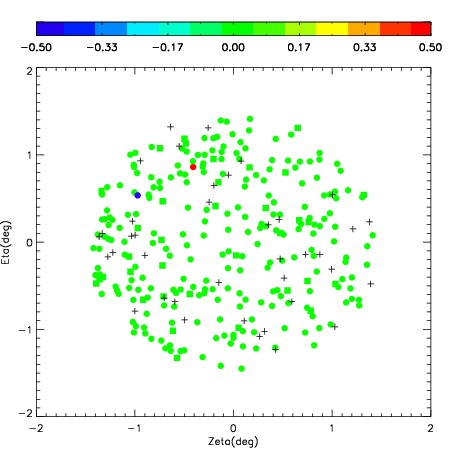
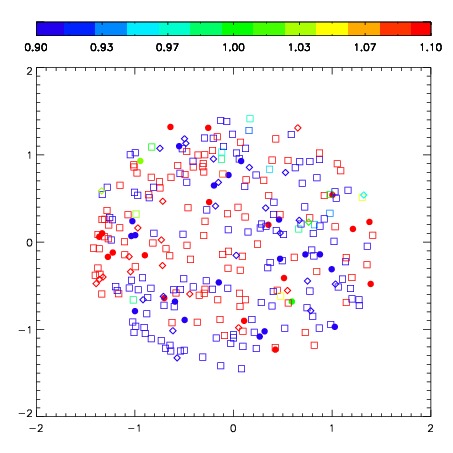

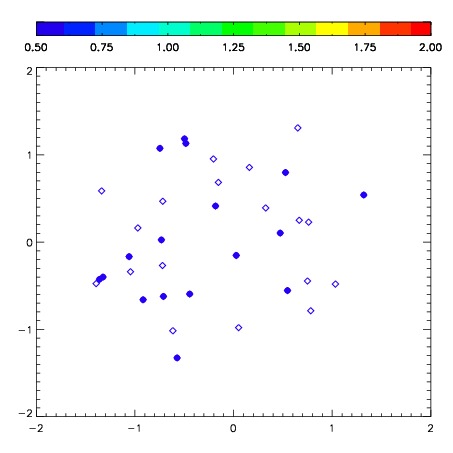
| Frame | Nreads | Zeropoints | Mag plots | Spatial mag deviation | Spatial sky 16325A emission deviations (filled: sky, open: star) | Spatial sky continuum emission | Spatial sky telluric CO2 absorption deviations (filled: H < 10) | |||||||||||||||||||||||
| 0 | 0 |
|
|
|
|
|
|
| IPAIR | NAME | SHIFT | NEWSHIFT | S/N | NAME | SHIFT | NEWSHIFT | S/N |
| 0 | 03720066 | 0.449572 | 0.00000 | 304.426 | 03720063 | 0.0120806 | 0.437491 | 309.908 |
| 1 | 03720065 | 0.432946 | 0.0166260 | 311.076 | 03720060 | 0.00000 | 0.449572 | 314.920 |
| 2 | 03720062 | 0.436896 | 0.0126760 | 310.759 | 03720064 | 0.0123200 | 0.437252 | 312.408 |
| 3 | 03720061 | 0.440649 | 0.00892299 | 309.997 | 03720067 | 0.0137475 | 0.435824 | 311.555 |