| Red | Green | Blue | |
| z | 17.64 | ||
| znorm | Inf | ||
| sky | -Inf | -Inf | -Inf |
| S/N | 3.7 | 6.6 | 7.5 |
| S/N(c) | 0.0 | 0.0 | 0.0 |
| SN(E/C) |

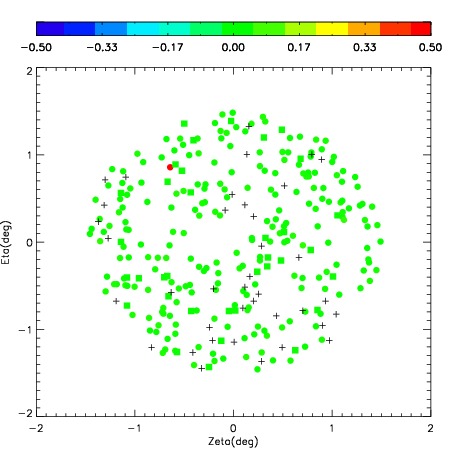

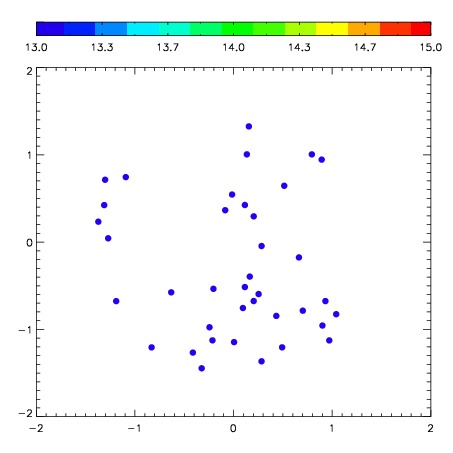
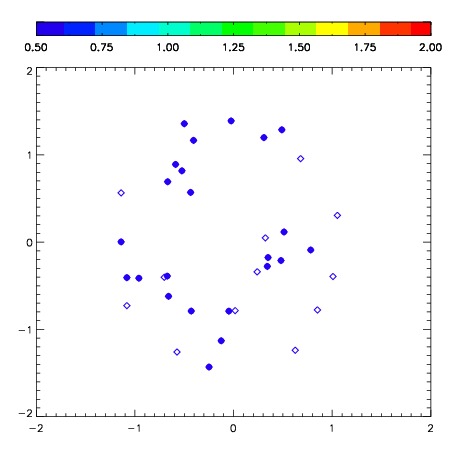
| Frame | Nreads | Zeropoints | Mag plots | Spatial mag deviation | Spatial sky 16325A emission deviations (filled: sky, open: star) | Spatial sky continuum emission | Spatial sky telluric CO2 absorption deviations (filled: H < 10) | |||||||||||||||||||||||
| 0 | 0 |
|
|
|
|
|
|
| IPAIR | NAME | SHIFT | NEWSHIFT | S/N | NAME | SHIFT | NEWSHIFT | S/N |
| 0 | 03990037 | 0.477281 | 0.00000 | 72.2881 | 03990034 | 0.0289240 | 0.448357 | 48.3864 |
| 1 | 03990032 | 0.448704 | 0.0285770 | 112.995 | 03990031 | 0.00000 | 0.477281 | 112.198 |
| 2 | 03990033 | 0.472579 | 0.00470200 | 77.1616 | 03990035 | 0.0223762 | 0.454905 | 56.6807 |
| 3 | 03990036 | 0.475893 | 0.00138801 | 46.6286 | 03990038 | 0.0256034 | 0.451678 | 47.3196 |