| Red | Green | Blue | |
| z | 17.64 | ||
| znorm | Inf | ||
| sky | -NaN | -NaN | -Inf |
| S/N | 25.4 | 43.9 | 48.0 |
| S/N(c) | 0.0 | 0.0 | 0.0 |
| SN(E/C) |

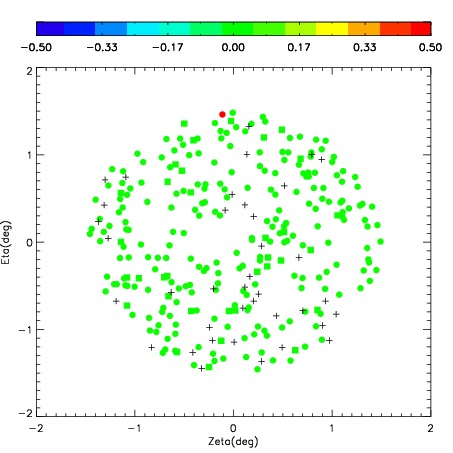
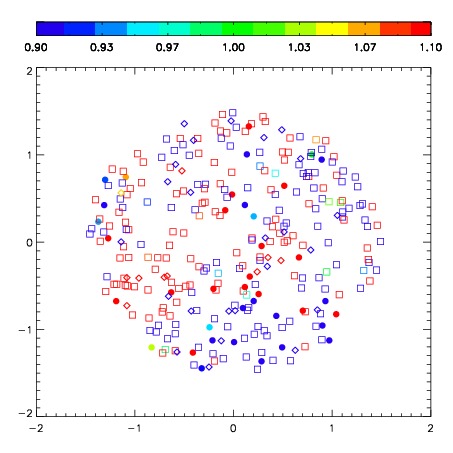
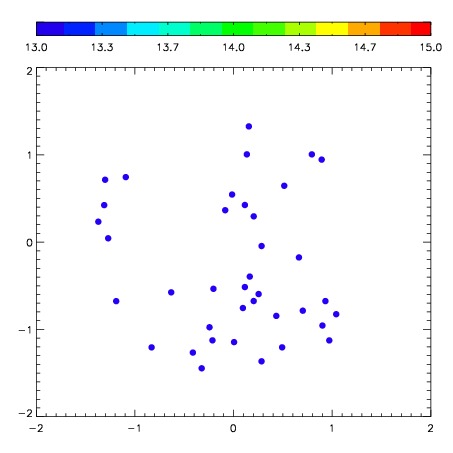
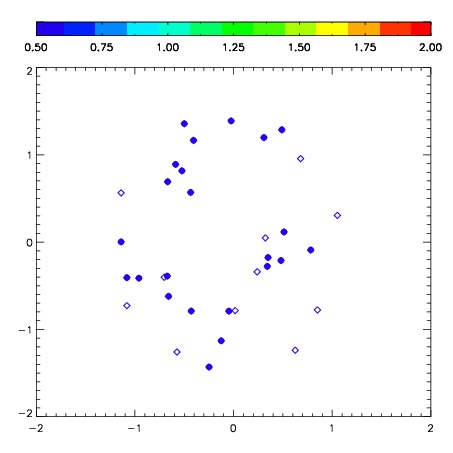
| Frame | Nreads | Zeropoints | Mag plots | Spatial mag deviation | Spatial sky 16325A emission deviations (filled: sky, open: star) | Spatial sky continuum emission | Spatial sky telluric CO2 absorption deviations (filled: H < 10) | |||||||||||||||||||||||
| 0 | 0 |
|
|
|
|
|
|
| IPAIR | NAME | SHIFT | NEWSHIFT | S/N | NAME | SHIFT | NEWSHIFT | S/N |
| 0 | 04040026 | 0.409986 | 0.00000 | 211.372 | 04040025 | 0.00000 | 0.409986 | 218.788 |
| 1 | 04040031 | 0.391974 | 0.0180120 | 248.914 | 04040032 | -0.00416276 | 0.414149 | 256.171 |
| 2 | 04040030 | 0.391271 | 0.0187150 | 244.280 | 04040029 | -0.000986516 | 0.410973 | 236.482 |
| 3 | 04040027 | 0.402960 | 0.00702599 | 218.585 | 04040028 | -0.000146851 | 0.410133 | 223.497 |