| Red | Green | Blue | |
| z | 17.64 | ||
| znorm | Inf | ||
| sky | -Inf | -Inf | -Inf |
| S/N | 30.1 | 46.6 | 44.7 |
| S/N(c) | 0.0 | 0.0 | 0.0 |
| SN(E/C) |
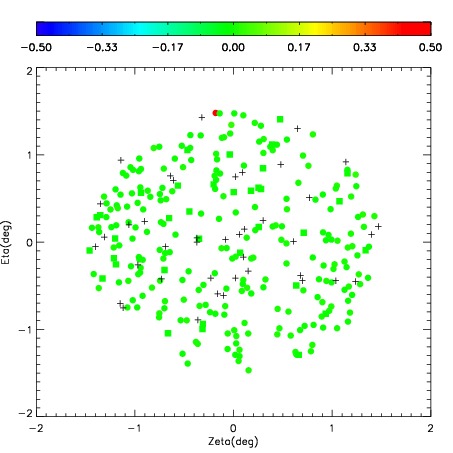
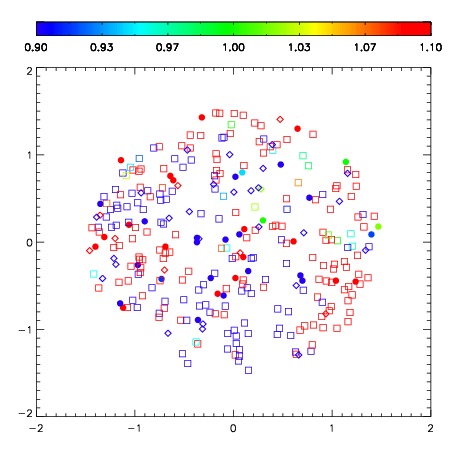
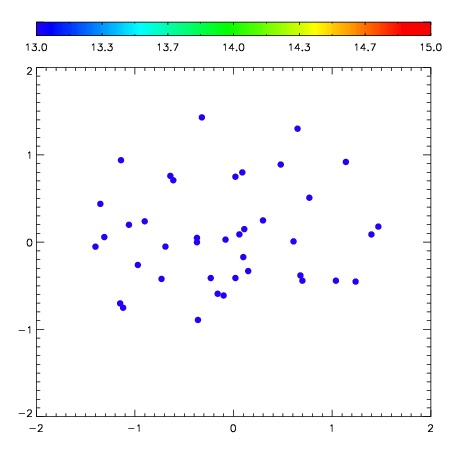
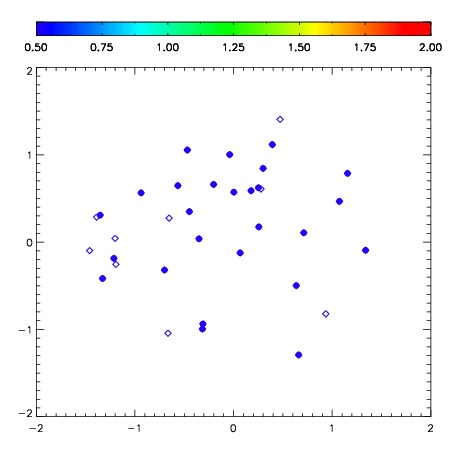
| Frame | Nreads | Zeropoints | Mag plots | Spatial mag deviation | Spatial sky 16325A emission deviations (filled: sky, open: star) | Spatial sky continuum emission | Spatial sky telluric CO2 absorption deviations (filled: H < 10) | |||||||||||||||||||||||
| 0 | 0 |
|
|
|
|
|
|
| IPAIR | NAME | SHIFT | NEWSHIFT | S/N | NAME | SHIFT | NEWSHIFT | S/N |
| 0 | 10200012 | 0.566656 | 0.00000 | 292.296 | 10200014 | 0.0443106 | 0.522345 | 291.460 |
| 1 | 10200013 | 0.559276 | 0.00738001 | 292.186 | 10200011 | 0.00000 | 0.566656 | 287.786 |
| 2 | 10200017 | 0.552240 | 0.0144160 | 277.138 | 10200015 | 0.0550734 | 0.511583 | 287.092 |
| 3 | 10200016 | 0.546041 | 0.0206150 | 274.377 | 10200018 | 0.0424575 | 0.524198 | 276.082 |