| Red | Green | Blue | |
| z | 17.64 | ||
| znorm | Inf | ||
| sky | -Inf | -Inf | -Inf |
| S/N | 24.9 | 40.6 | 43.1 |
| S/N(c) | 0.0 | 0.0 | 0.0 |
| SN(E/C) |

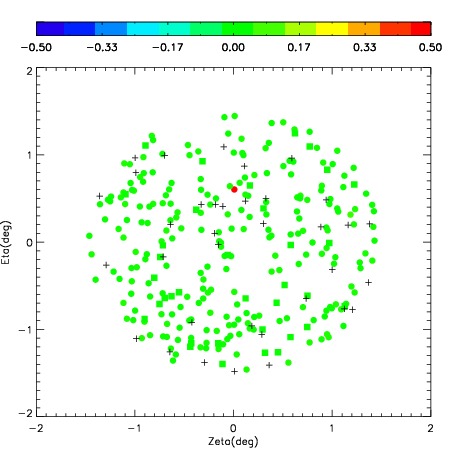
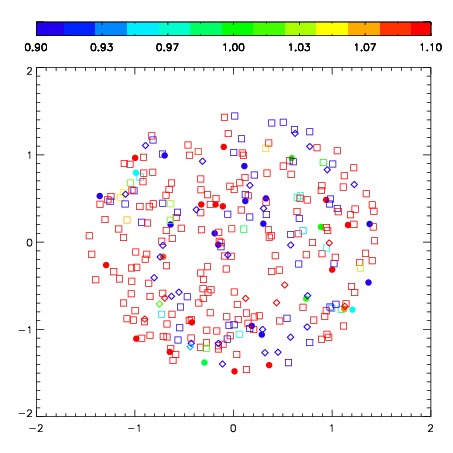
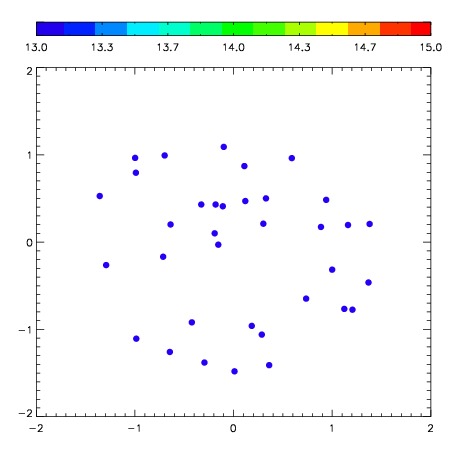

| Frame | Nreads | Zeropoints | Mag plots | Spatial mag deviation | Spatial sky 16325A emission deviations (filled: sky, open: star) | Spatial sky continuum emission | Spatial sky telluric CO2 absorption deviations (filled: H < 10) | |||||||||||||||||||||||
| 0 | 0 |
|
|
|
|
|
|
| IPAIR | NAME | SHIFT | NEWSHIFT | S/N | NAME | SHIFT | NEWSHIFT | S/N |
| 0 | 09060061 | 0.482493 | 0.00000 | 261.958 | 09060063 | 0.0119792 | 0.470514 | 262.576 |
| 1 | 09060064 | 0.480701 | 0.00179201 | 265.785 | 09060062 | 0.0107438 | 0.471749 | 266.288 |
| 2 | 09060060 | 0.481917 | 0.000576019 | 254.466 | 09060059 | 0.00000 | 0.482493 | 249.844 |