| Red | Green | Blue | |
| z | 17.64 | ||
| znorm | Inf | ||
| sky | -Inf | -Inf | -Inf |
| S/N | 29.7 | 48.1 | 51.7 |
| S/N(c) | 0.0 | 0.0 | 0.0 |
| SN(E/C) |


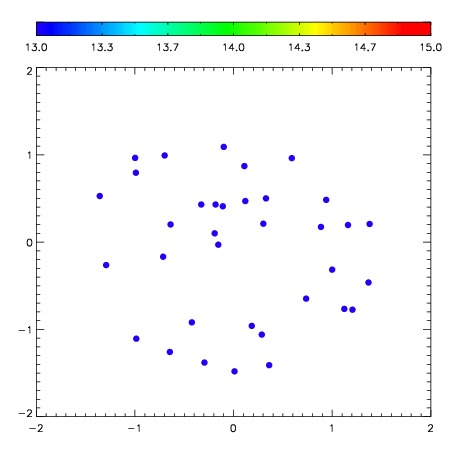
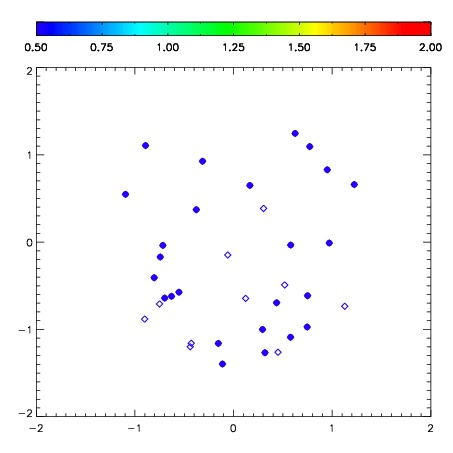
| Frame | Nreads | Zeropoints | Mag plots | Spatial mag deviation | Spatial sky 16325A emission deviations (filled: sky, open: star) | Spatial sky continuum emission | Spatial sky telluric CO2 absorption deviations (filled: H < 10) | |||||||||||||||||||||||
| 0 | 0 |
|
|
|
|
|
|
| IPAIR | NAME | SHIFT | NEWSHIFT | S/N | NAME | SHIFT | NEWSHIFT | S/N |
| 0 | 10150027 | 0.539430 | 0.00000 | 256.892 | 10150029 | 0.0509584 | 0.488472 | 259.958 |
| 1 | 10150028 | 0.535368 | 0.00406200 | 263.116 | 10150030 | 0.0491512 | 0.490279 | 260.929 |
| 2 | 10150031 | 0.532583 | 0.00684702 | 260.739 | 10150033 | 0.0529320 | 0.486498 | 260.605 |
| 3 | 10150032 | 0.535867 | 0.00356305 | 256.548 | 10150026 | 0.00000 | 0.539430 | 253.961 |