| Red | Green | Blue | |
| z | 17.64 | ||
| znorm | Inf | ||
| sky | -Inf | -Inf | -Inf |
| S/N | 18.3 | 31.9 | 37.2 |
| S/N(c) | 0.0 | 0.0 | 0.0 |
| SN(E/C) |


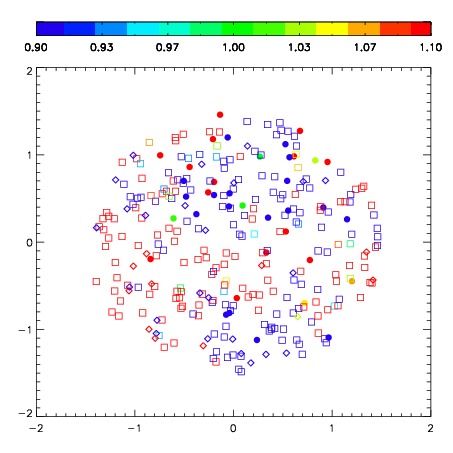
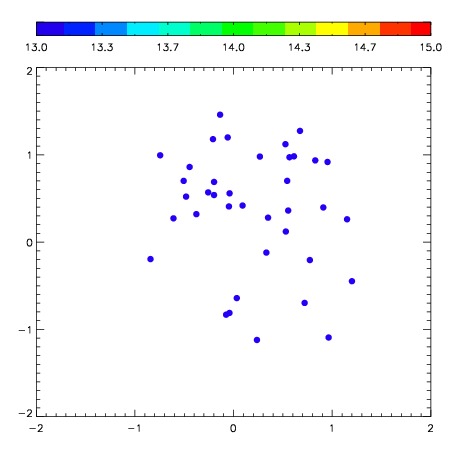
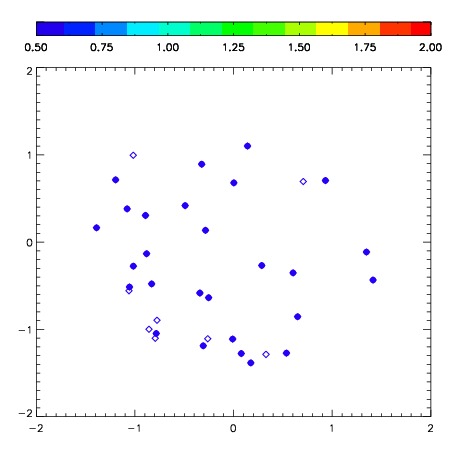
| Frame | Nreads | Zeropoints | Mag plots | Spatial mag deviation | Spatial sky 16325A emission deviations (filled: sky, open: star) | Spatial sky continuum emission | Spatial sky telluric CO2 absorption deviations (filled: H < 10) | |||||||||||||||||||||||
| 0 | 0 |
|
|
|
|
|
|
| IPAIR | NAME | SHIFT | NEWSHIFT | S/N | NAME | SHIFT | NEWSHIFT | S/N |
| 0 | 09100046 | 0.567718 | 0.00000 | 173.124 | 09100048 | 0.0595961 | 0.508122 | 184.959 |
| 1 | 09100050 | 0.546779 | 0.0209391 | 258.748 | 09100051 | 0.0494082 | 0.518310 | 277.528 |
| 2 | 09100045 | 0.555752 | 0.0119660 | 245.677 | 09100044 | 0.00000 | 0.567718 | 243.012 |
| 3 | 09100049 | 0.548751 | 0.0189670 | 210.449 | 09100047 | 0.0561397 | 0.511578 | 185.291 |