| Red | Green | Blue | |
| z | 17.64 | ||
| znorm | Inf | ||
| sky | -Inf | -Inf | -Inf |
| S/N | 30.7 | 51.3 | 53.2 |
| S/N(c) | 0.0 | 0.0 | 0.0 |
| SN(E/C) |
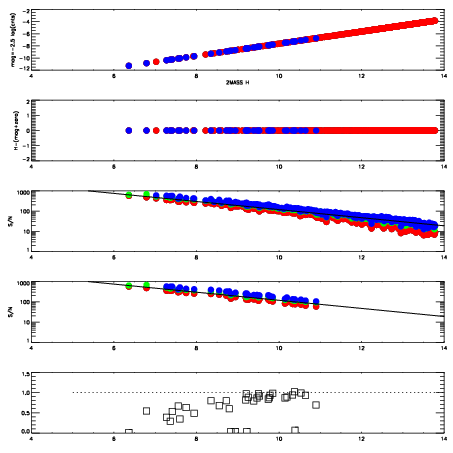
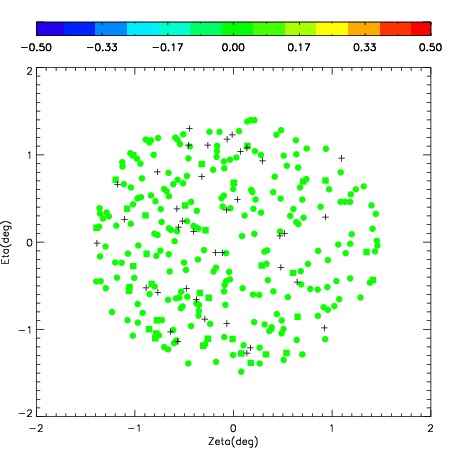

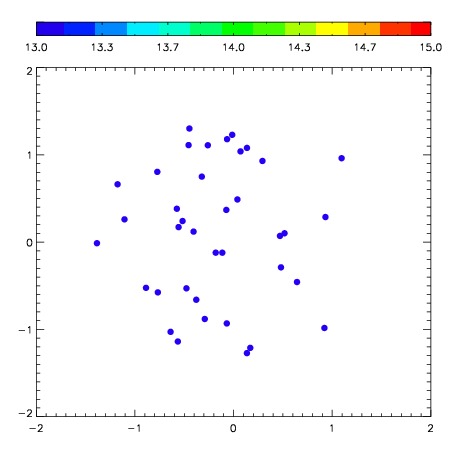
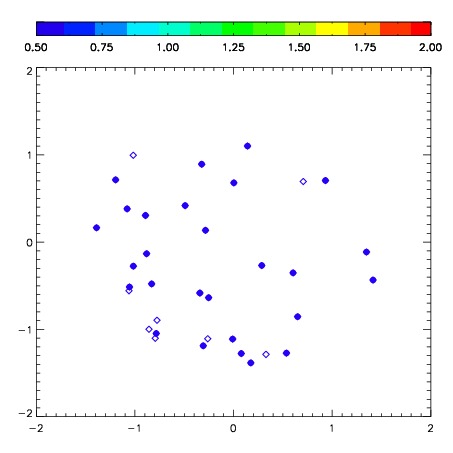
| Frame | Nreads | Zeropoints | Mag plots | Spatial mag deviation | Spatial sky 16325A emission deviations (filled: sky, open: star) | Spatial sky continuum emission | Spatial sky telluric CO2 absorption deviations (filled: H < 10) | |||||||||||||||||||||||
| 0 | 0 |
|
|
|
|
|
|
| IPAIR | NAME | SHIFT | NEWSHIFT | S/N | NAME | SHIFT | NEWSHIFT | S/N |
| 0 | 03050026 | 0.479822 | 0.00000 | 260.737 | 03050028 | 0.0130228 | 0.466799 | 261.610 |
| 1 | 03050025 | 0.479366 | 0.000456005 | 261.474 | 03050024 | 0.00000 | 0.479822 | 263.378 |
| 2 | 03050030 | 0.469757 | 0.0100650 | 258.154 | 03050027 | 0.0111732 | 0.468649 | 261.132 |
| 3 | 03050029 | 0.470059 | 0.00976300 | 255.138 | 03050031 | 0.0133299 | 0.466492 | 257.119 |