| Red | Green | Blue | |
| z | 17.64 | ||
| znorm | Inf | ||
| sky | -Inf | -Inf | -Inf |
| S/N | 22.4 | 39.1 | 41.0 |
| S/N(c) | 0.0 | 0.0 | 0.0 |
| SN(E/C) |

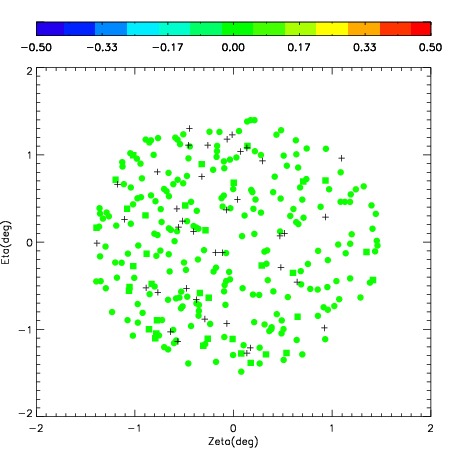

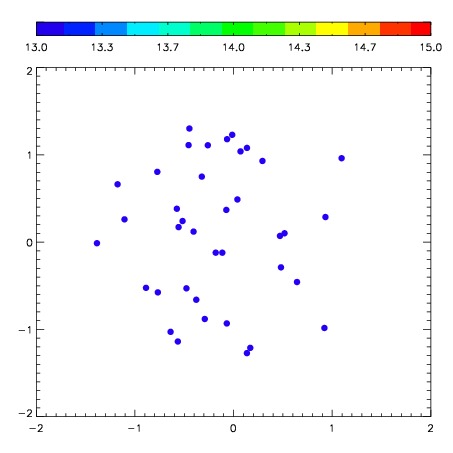

| Frame | Nreads | Zeropoints | Mag plots | Spatial mag deviation | Spatial sky 16325A emission deviations (filled: sky, open: star) | Spatial sky continuum emission | Spatial sky telluric CO2 absorption deviations (filled: H < 10) | |||||||||||||||||||||||
| 0 | 0 |
|
|
|
|
|
|
| IPAIR | NAME | SHIFT | NEWSHIFT | S/N | NAME | SHIFT | NEWSHIFT | S/N |
| 0 | 09150012 | 0.542881 | 0.00000 | 181.548 | 09150019 | 0.0537153 | 0.489166 | 166.287 |
| 1 | 09150013 | 0.537563 | 0.00531799 | 204.856 | 09150011 | 0.00000 | 0.542881 | 205.792 |
| 2 | 09150016 | 0.534031 | 0.00885004 | 183.681 | 09150015 | 0.0525322 | 0.490349 | 180.979 |
| 3 | 09150017 | 0.541486 | 0.00139499 | 145.335 | 09150014 | 0.0522236 | 0.490657 | 160.923 |
| 4 | 09150020 | 0.541000 | 0.00188100 | 136.381 | 09150018 | 0.0620808 | 0.480800 | 103.458 |