| Red | Green | Blue | |
| z | 17.64 | ||
| znorm | Inf | ||
| sky | -NaN | -NaN | -Inf |
| S/N | 22.9 | 35.9 | 40.0 |
| S/N(c) | 22.9 | 35.9 | 40.0 |
| SN(E/C) |


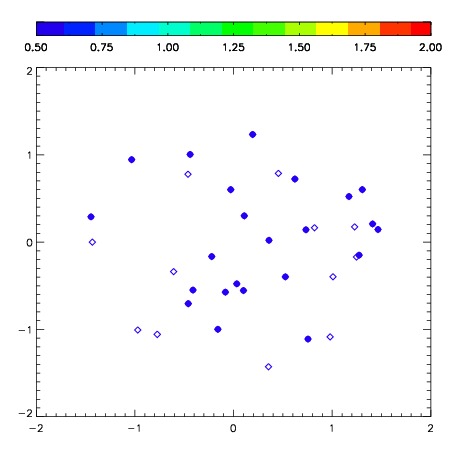
| Frame | Nreads | Zeropoints | Mag plots | Spatial mag deviation | Spatial sky 16325A emission deviations (filled: sky, open: star) | Spatial sky continuum emission | Spatial sky telluric CO2 absorption deviations (filled: H < 10) | |||||||||||||||||||||||
| 0 | 0 |
|
|
|
|
|
|
| IPAIR | NAME | SHIFT | NEWSHIFT | S/N | NAME | SHIFT | NEWSHIFT | S/N |
| 0 | 03100020 | 0.333324 | 0.00000 | 234.112 | 03100017 | -0.00191656 | 0.335241 | 222.963 |
| 1 | 03100016 | 0.315226 | 0.0180980 | 254.476 | 03100021 | -0.00424132 | 0.337565 | 252.749 |
| 2 | 03100015 | 0.316933 | 0.0163910 | 243.873 | 03100014 | 0.00000 | 0.333324 | 249.306 |
| 3 | 03100019 | 0.326027 | 0.00729698 | 240.692 | 03100018 | -0.00371620 | 0.337040 | 231.422 |