| Red | Green | Blue | |
| z | 17.64 | ||
| znorm | Inf | ||
| sky | -Inf | -NaN | -Inf |
| S/N | 30.1 | 43.5 | 47.2 |
| S/N(c) | 0.0 | 0.0 | 0.0 |
| SN(E/C) |

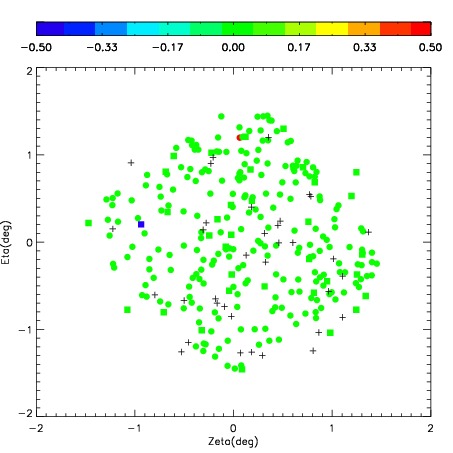
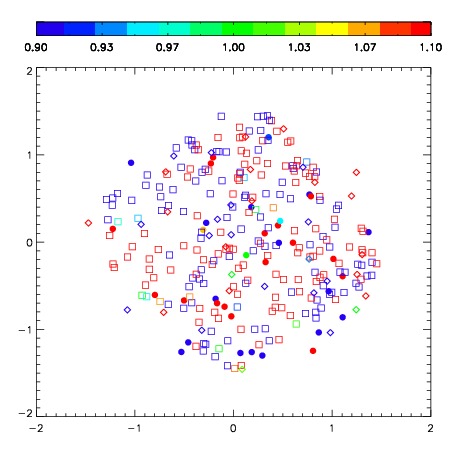


| Frame | Nreads | Zeropoints | Mag plots | Spatial mag deviation | Spatial sky 16325A emission deviations (filled: sky, open: star) | Spatial sky continuum emission | Spatial sky telluric CO2 absorption deviations (filled: H < 10) | |||||||||||||||||||||||
| 0 | 0 |
|
|
|
|
|
|
| IPAIR | NAME | SHIFT | NEWSHIFT | S/N | NAME | SHIFT | NEWSHIFT | S/N |
| 0 | 03120015 | 0.310354 | 0.00000 | 222.834 | 03120014 | -0.00735252 | 0.317707 | 220.764 |
| 1 | 03120016 | 0.302728 | 0.00762600 | 226.320 | 03120017 | -0.00777654 | 0.318131 | 225.136 |
| 2 | 03120012 | 0.299495 | 0.0108590 | 214.239 | 03120013 | -0.00520467 | 0.315559 | 218.758 |
| 3 | 03120011 | 0.303420 | 0.00693399 | 213.597 | 03120010 | 0.00000 | 0.310354 | 217.595 |