| Red | Green | Blue | |
| z | 17.64 | ||
| znorm | Inf | ||
| sky | -Inf | -Inf | -Inf |
| S/N | 26.1 | 44.2 | 47.4 |
| S/N(c) | 0.0 | 0.0 | 0.0 |
| SN(E/C) |

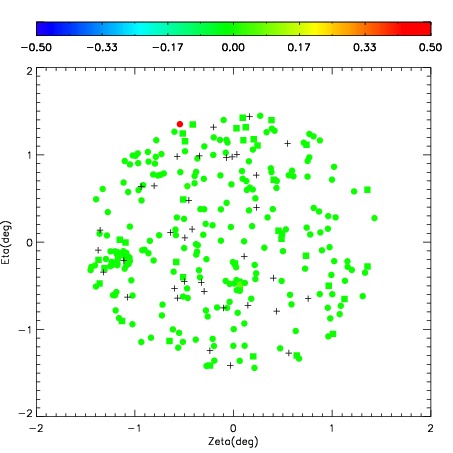
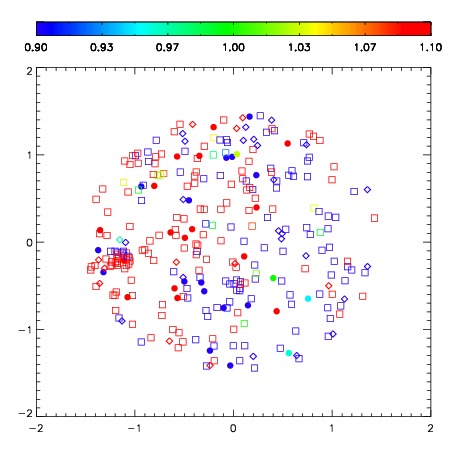

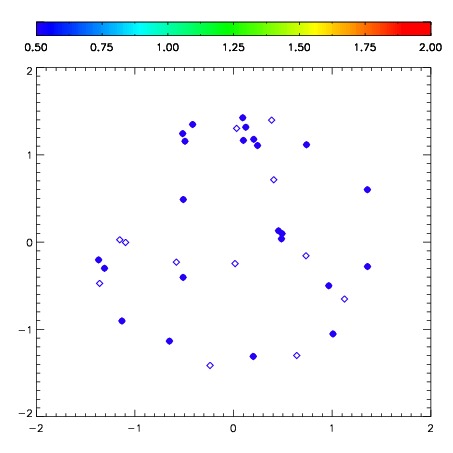
| Frame | Nreads | Zeropoints | Mag plots | Spatial mag deviation | Spatial sky 16325A emission deviations (filled: sky, open: star) | Spatial sky continuum emission | Spatial sky telluric CO2 absorption deviations (filled: H < 10) | |||||||||||||||||||||||
| 0 | 0 |
|
|
|
|
|
|
| IPAIR | NAME | SHIFT | NEWSHIFT | S/N | NAME | SHIFT | NEWSHIFT | S/N |
| 0 | 10540027 | 0.434886 | 0.00000 | 247.483 | 10540026 | 0.00000 | 0.434886 | 250.665 |
| 1 | 10540032 | 0.420966 | 0.0139200 | 233.863 | 10540029 | 0.0187279 | 0.416158 | 244.744 |
| 2 | 10540028 | 0.433728 | 0.00115800 | 228.126 | 10540033 | 0.0156576 | 0.419228 | 233.114 |
| 3 | 10540031 | 0.427426 | 0.00746000 | 221.346 | 10540030 | 0.0187356 | 0.416150 | 230.691 |