| Red | Green | Blue | |
| z | 17.64 | ||
| znorm | Inf | ||
| sky | -Inf | -Inf | -Inf |
| S/N | 26.5 | 45.4 | 49.1 |
| S/N(c) | 0.0 | 0.0 | 0.0 |
| SN(E/C) |

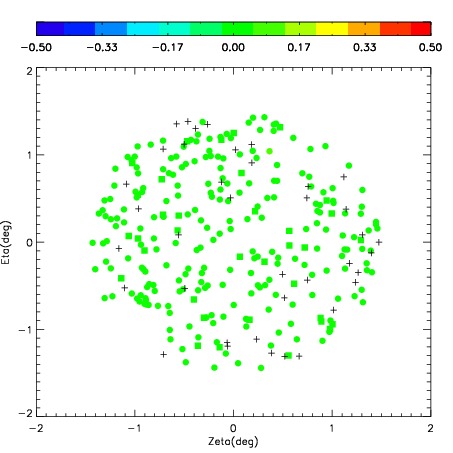

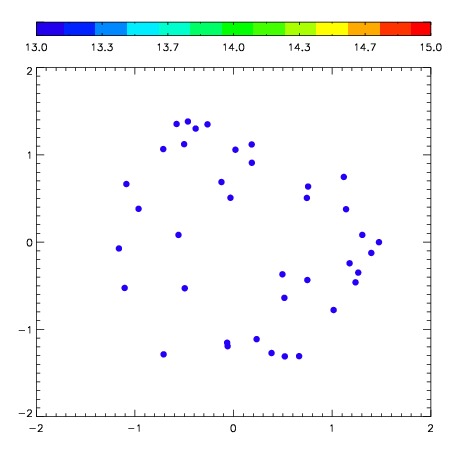
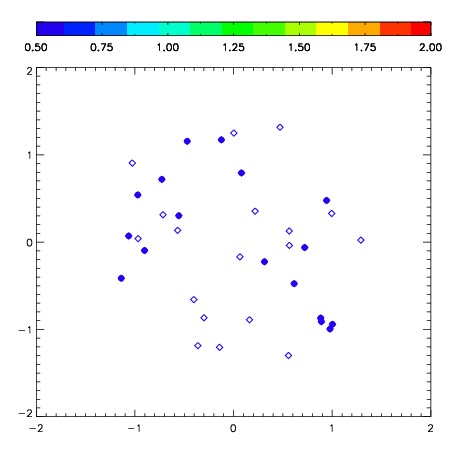
| Frame | Nreads | Zeropoints | Mag plots | Spatial mag deviation | Spatial sky 16325A emission deviations (filled: sky, open: star) | Spatial sky continuum emission | Spatial sky telluric CO2 absorption deviations (filled: H < 10) | |||||||||||||||||||||||
| 0 | 0 |
|
|
|
|
|
|
| IPAIR | NAME | SHIFT | NEWSHIFT | S/N | NAME | SHIFT | NEWSHIFT | S/N |
| 0 | 07000028 | 0.448946 | 0.00000 | 311.560 | 07000022 | 0.00000 | 0.448946 | 315.228 |
| 1 | 07000024 | 0.448413 | 0.000532985 | 324.789 | 07000025 | 0.0266342 | 0.422312 | 322.084 |
| 2 | 07000023 | 0.447588 | 0.00135800 | 324.112 | 07000026 | 0.0252947 | 0.423651 | 320.236 |
| 3 | 07000027 | 0.447263 | 0.00168300 | 318.881 | 07000029 | 0.0259496 | 0.422996 | 316.889 |