| Red | Green | Blue | |
| z | 17.64 | ||
| znorm | Inf | ||
| sky | -Inf | -Inf | -Inf |
| S/N | 9.5 | 17.7 | 20.4 |
| S/N(c) | 0.0 | 0.0 | 0.0 |
| SN(E/C) |
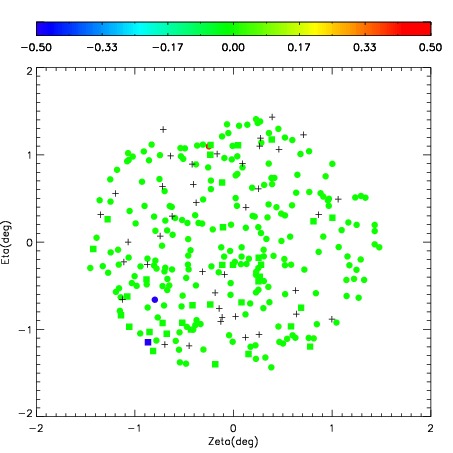
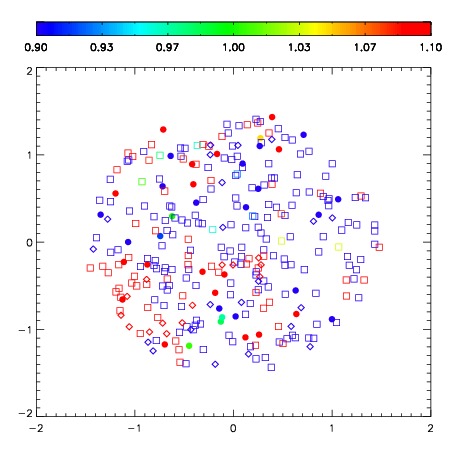
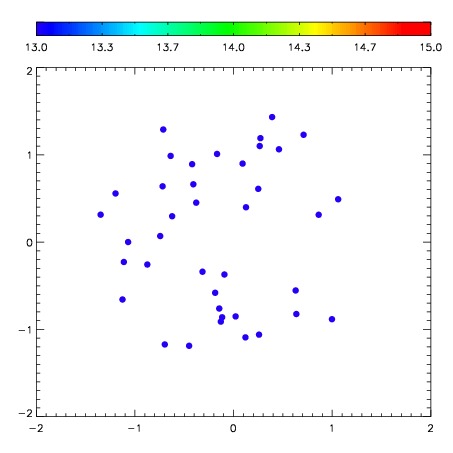
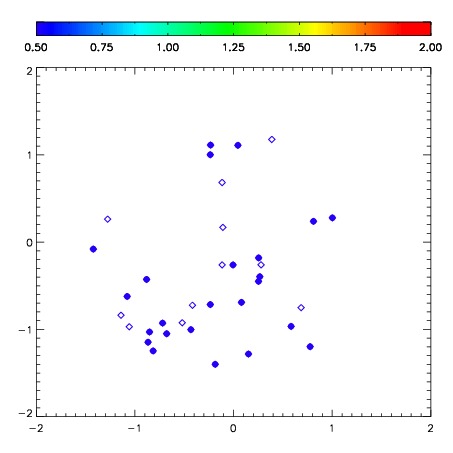
| Frame | Nreads | Zeropoints | Mag plots | Spatial mag deviation | Spatial sky 16325A emission deviations (filled: sky, open: star) | Spatial sky continuum emission | Spatial sky telluric CO2 absorption deviations (filled: H < 10) | |||||||||||||||||||||||
| 0 | 0 |
|
|
|
|
|
|
| IPAIR | NAME | SHIFT | NEWSHIFT | S/N | NAME | SHIFT | NEWSHIFT | S/N |
| 0 | 10270060 | 0.508737 | 0.00000 | 113.453 | 10270062 | 0.0497971 | 0.458940 | 20.3357 |
| 1 | 10270056 | 0.462081 | 0.0466560 | 231.921 | 10270055 | 0.00000 | 0.508737 | 261.634 |
| 2 | 10270057 | 0.470178 | 0.0385590 | 199.629 | 10270058 | 0.0474937 | 0.461243 | 89.2686 |