| Red | Green | Blue | |
| z | 17.64 | ||
| znorm | Inf | ||
| sky | -NaN | -NaN | -Inf |
| S/N | 30.8 | 51.8 | 56.7 |
| S/N(c) | 0.0 | 0.0 | 0.0 |
| SN(E/C) |

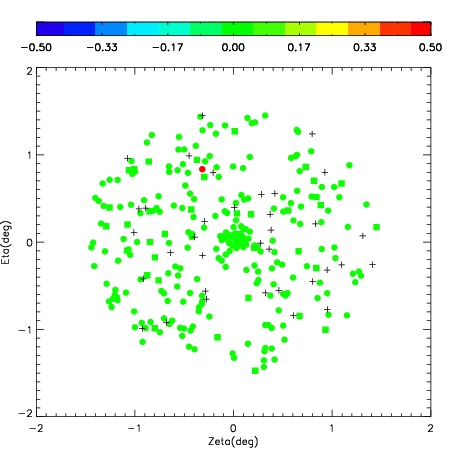
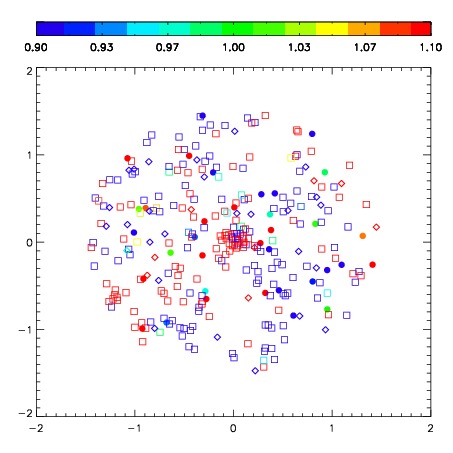
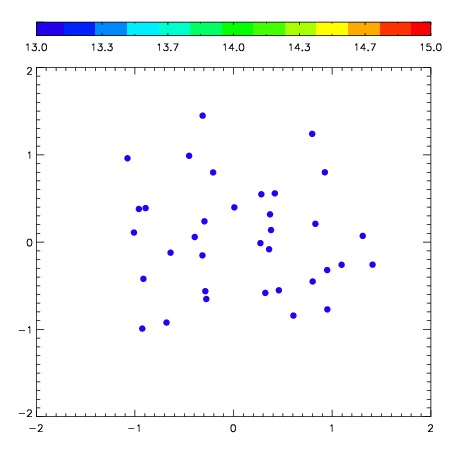
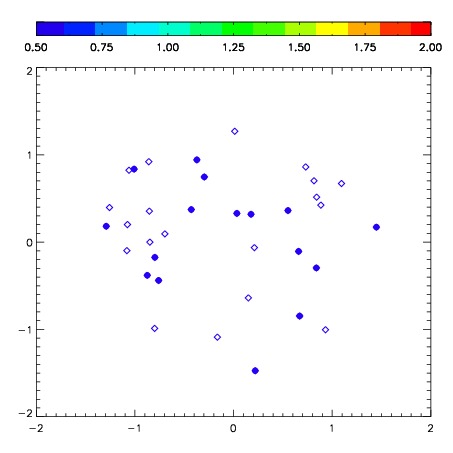
| Frame | Nreads | Zeropoints | Mag plots | Spatial mag deviation | Spatial sky 16325A emission deviations (filled: sky, open: star) | Spatial sky continuum emission | Spatial sky telluric CO2 absorption deviations (filled: H < 10) | |||||||||||||||||||||||
| 0 | 0 |
|
|
|
|
|
|
| IPAIR | NAME | SHIFT | NEWSHIFT | S/N | NAME | SHIFT | NEWSHIFT | S/N |
| 0 | 03410094 | 0.345525 | 0.00000 | 249.822 | 03410096 | -0.0248135 | 0.370338 | 262.694 |
| 1 | 03410093 | 0.342055 | 0.00347000 | 269.728 | 03410095 | -0.0246841 | 0.370209 | 267.544 |
| 2 | 03410098 | 0.336706 | 0.00881898 | 267.185 | 03410099 | -0.0232151 | 0.368740 | 267.196 |
| 3 | 03410097 | 0.328833 | 0.0166920 | 261.026 | 03410092 | 0.00000 | 0.345525 | 266.529 |
| 4 | 03410102 | 0.329977 | 0.0155480 | 250.561 | 03410100 | -0.0269722 | 0.372497 | 265.829 |