| Red | Green | Blue | |
| z | 17.64 | ||
| znorm | Inf | ||
| sky | -NaN | -NaN | -Inf |
| S/N | 17.5 | 32.6 | 35.1 |
| S/N(c) | 0.0 | 0.0 | 0.0 |
| SN(E/C) |

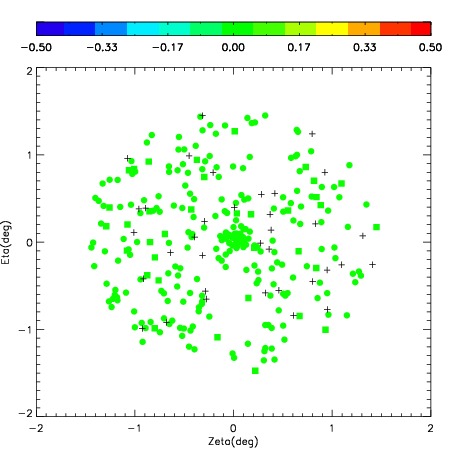
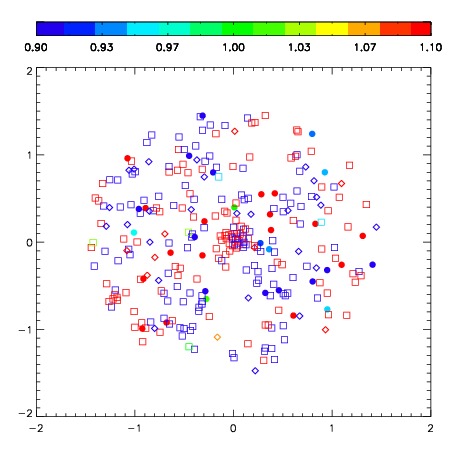


| Frame | Nreads | Zeropoints | Mag plots | Spatial mag deviation | Spatial sky 16325A emission deviations (filled: sky, open: star) | Spatial sky continuum emission | Spatial sky telluric CO2 absorption deviations (filled: H < 10) | |||||||||||||||||||||||
| 0 | 0 |
|
|
|
|
|
|
| IPAIR | NAME | SHIFT | NEWSHIFT | S/N | NAME | SHIFT | NEWSHIFT | S/N |
| 0 | 03680072 | 0.366155 | 0.00000 | 258.798 | 03680075 | -0.0114348 | 0.377590 | 259.522 |
| 1 | 03680073 | 0.365783 | 0.000371993 | 265.236 | 03680074 | -0.00827220 | 0.374427 | 269.791 |
| 2 | 03680076 | 0.360865 | 0.00529000 | 256.225 | 03680078 | -0.0127912 | 0.378946 | 259.328 |
| 3 | 03680077 | 0.361719 | 0.00443599 | 253.986 | 03680071 | 0.00000 | 0.366155 | 241.697 |