| Red | Green | Blue | |
| z | 17.64 | ||
| znorm | Inf | ||
| sky | -Inf | -Inf | -Inf |
| S/N | 32.1 | 54.6 | 59.8 |
| S/N(c) | 0.0 | 0.0 | 0.0 |
| SN(E/C) |


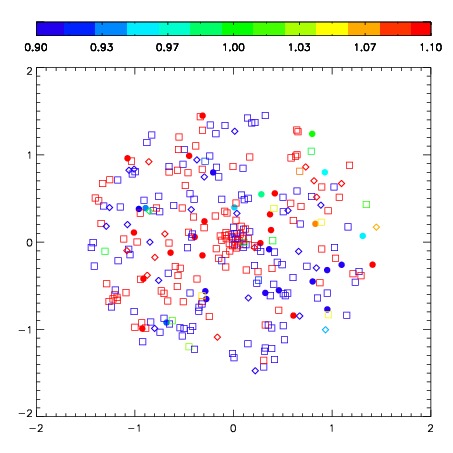
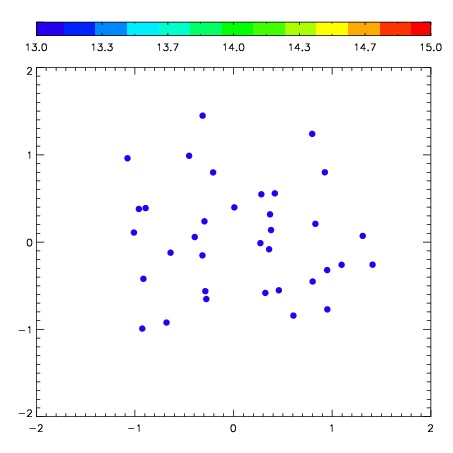

| Frame | Nreads | Zeropoints | Mag plots | Spatial mag deviation | Spatial sky 16325A emission deviations (filled: sky, open: star) | Spatial sky continuum emission | Spatial sky telluric CO2 absorption deviations (filled: H < 10) | |||||||||||||||||||||||
| 0 | 0 |
|
|
|
|
|
|
| IPAIR | NAME | SHIFT | NEWSHIFT | S/N | NAME | SHIFT | NEWSHIFT | S/N |
| 0 | 03720081 | 0.319869 | 0.00000 | 282.597 | 03720074 | -0.0450959 | 0.364965 | 283.744 |
| 1 | 03720073 | 0.314353 | 0.00551602 | 278.883 | 03720075 | -0.0481453 | 0.368014 | 282.769 |
| 2 | 03720080 | 0.316663 | 0.00320601 | 278.294 | 03720079 | -0.0524426 | 0.372312 | 282.324 |
| 3 | 03720077 | 0.319709 | 0.000160009 | 272.787 | 03720071 | 0.00000 | 0.319869 | 280.771 |
| 4 | 03720076 | 0.317343 | 0.00252602 | 271.098 | 03720082 | -0.0591219 | 0.378991 | 280.164 |
| 5 | 03720072 | 0.314363 | 0.00550601 | 263.567 | 03720078 | -0.0543080 | 0.374177 | 266.102 |