| Red | Green | Blue | |
| z | 17.64 | ||
| znorm | Inf | ||
| sky | -Inf | -Inf | -Inf |
| S/N | 24.8 | 43.8 | 46.8 |
| S/N(c) | 0.0 | 0.0 | 0.0 |
| SN(E/C) |

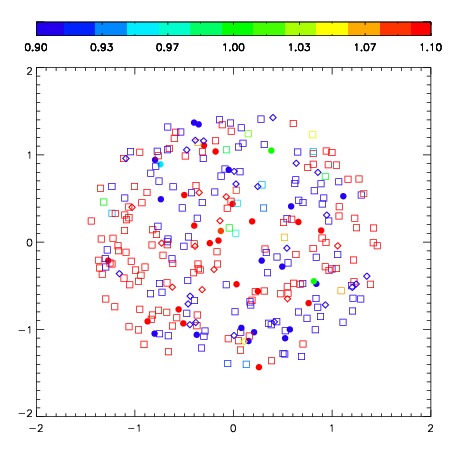
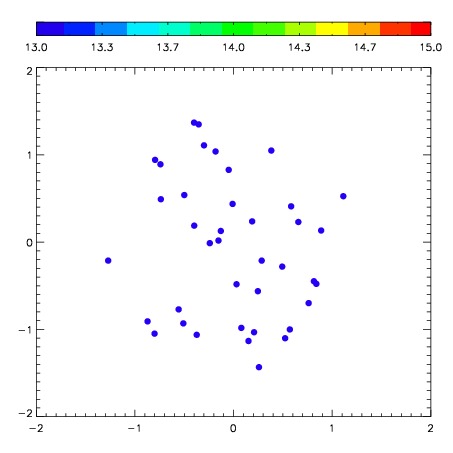
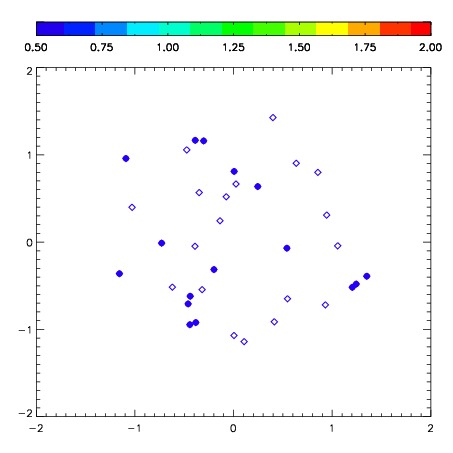
| Frame | Nreads | Zeropoints | Mag plots | Spatial mag deviation | Spatial sky 16325A emission deviations (filled: sky, open: star) | Spatial sky continuum emission | Spatial sky telluric CO2 absorption deviations (filled: H < 10) | |||||||||||||||||||||||
| 0 | 0 |
|
|
|
|
|
|
| IPAIR | NAME | SHIFT | NEWSHIFT | S/N | NAME | SHIFT | NEWSHIFT | S/N |
| 0 | 04560012 | 0.426760 | 0.00000 | 221.236 | 04560010 | 0.00000 | 0.426760 | 220.434 |
| 1 | 04560016 | 0.417388 | 0.00937200 | 227.616 | 04560017 | -0.0269448 | 0.453705 | 229.500 |
| 2 | 04560015 | 0.424293 | 0.00246698 | 221.912 | 04560013 | -0.0280858 | 0.454846 | 222.890 |
| 3 | 04560011 | 0.426180 | 0.000579983 | 219.089 | 04560014 | -0.0303315 | 0.457091 | 217.731 |