| Red | Green | Blue | |
| z | 17.66 | ||
| znorm | Inf | ||
| sky | -Inf | -Inf | -Inf |
| S/N | 31.4 | 56.7 | 59.0 |
| S/N(c) | 0.0 | 0.0 | 0.0 |
| SN(E/C) |

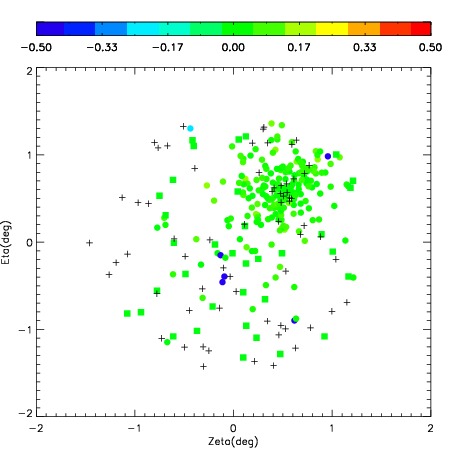
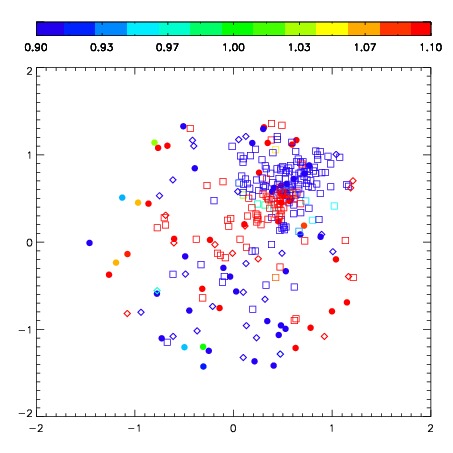
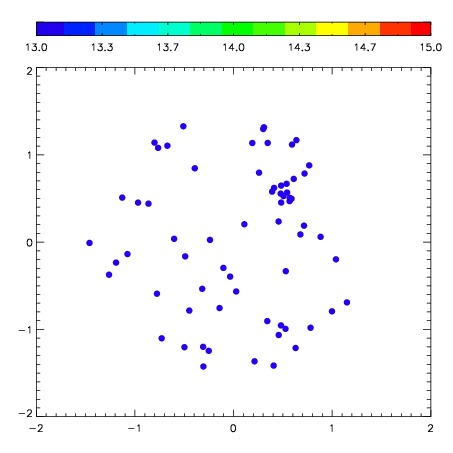
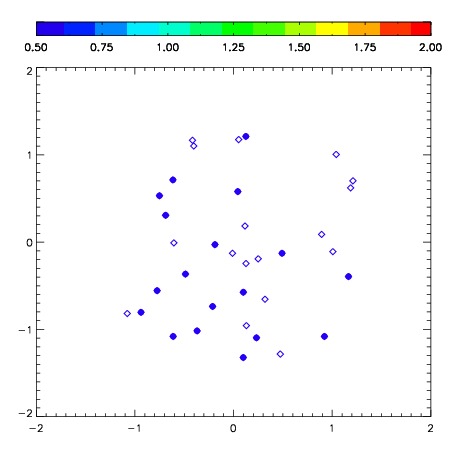
| Frame | Nreads | Zeropoints | Mag plots | Spatial mag deviation | Spatial sky 16325A emission deviations (filled: sky, open: star) | Spatial sky continuum emission | Spatial sky telluric CO2 absorption deviations (filled: H < 10) | |||||||||||||||||||||||
| 0 | 0 |
|
|
|
|
|
|
| IPAIR | NAME | SHIFT | NEWSHIFT | S/N | NAME | SHIFT | NEWSHIFT | S/N |
| 0 | 03410029 | 0.485812 | 0.00000 | 275.719 | 03410041 | -0.00482957 | 0.490642 | 269.081 |
| 1 | 03410028 | 0.478792 | 0.00702000 | 282.043 | 03410023 | 0.00000 | 0.485812 | 283.662 |
| 2 | 03410025 | 0.483147 | 0.00266501 | 279.484 | 03410040 | -0.00524560 | 0.491058 | 271.339 |
| 3 | 03410024 | 0.484201 | 0.00161099 | 273.946 | 03410037 | -0.00739896 | 0.493211 | 266.476 |
| 4 | 03410039 | 0.479866 | 0.00594601 | 272.250 | 03410026 | -0.00586838 | 0.491680 | 262.183 |
| 5 | 03410042 | 0.479139 | 0.00667301 | 270.168 | 03410030 | -0.00501969 | 0.490832 | 255.397 |
| 6 | 03410038 | 0.480105 | 0.00570700 | 264.199 | 03410044 | -0.00682938 | 0.492641 | 251.402 |
| 7 | 03410043 | 0.482021 | 0.00379100 | 260.930 | 03410027 | -0.00650731 | 0.492319 | 239.519 |