| Red | Green | Blue | |
| z | 17.66 | ||
| znorm | Inf | ||
| sky | -Inf | -Inf | -Inf |
| S/N | 20.9 | 38.3 | 39.4 |
| S/N(c) | 0.0 | 0.0 | 0.0 |
| SN(E/C) |
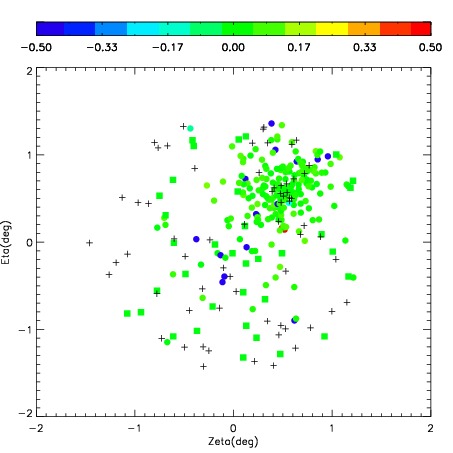
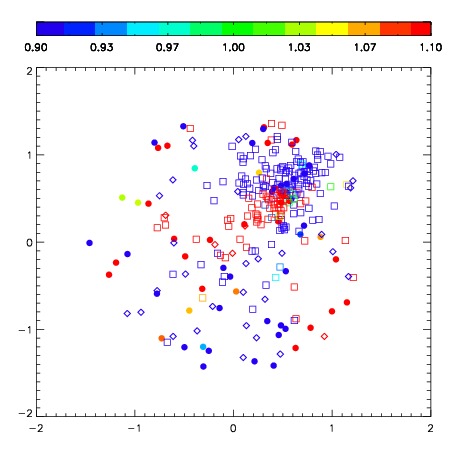
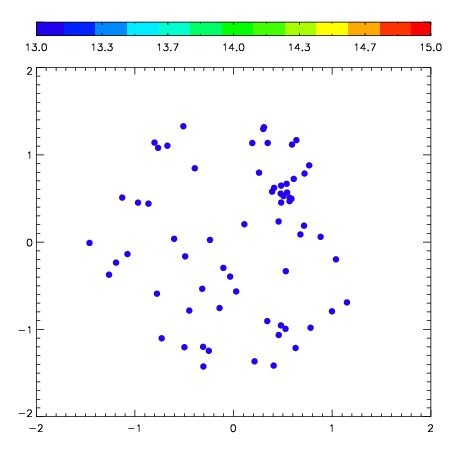
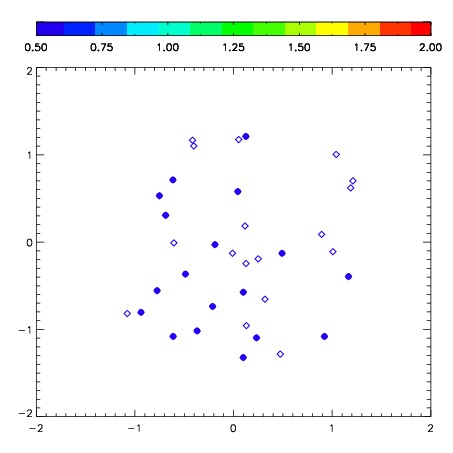
| Frame | Nreads | Zeropoints | Mag plots | Spatial mag deviation | Spatial sky 16325A emission deviations (filled: sky, open: star) | Spatial sky continuum emission | Spatial sky telluric CO2 absorption deviations (filled: H < 10) | |||||||||||||||||||||||
| 0 | 0 |
|
|
|
|
|
|
| IPAIR | NAME | SHIFT | NEWSHIFT | S/N | NAME | SHIFT | NEWSHIFT | S/N |
| 0 | 03420016 | 0.478765 | 0.00000 | 243.107 | 03420017 | 0.00552127 | 0.473244 | 248.993 |
| 1 | 03420011 | 0.472335 | 0.00643000 | 291.607 | 03420013 | 0.00447999 | 0.474285 | 274.825 |
| 2 | 03420015 | 0.471694 | 0.00707102 | 275.537 | 03420014 | 0.00169154 | 0.477073 | 269.617 |
| 3 | 03420012 | 0.475891 | 0.00287402 | 263.012 | 03420010 | 0.00000 | 0.478765 | 269.126 |