| Red | Green | Blue | |
| z | 17.75 | ||
| znorm | Inf | ||
| sky | -Inf | -Inf | -Inf |
| S/N | 24.5 | 43.2 | 45.0 |
| S/N(c) | 0.0 | 0.0 | 0.0 |
| SN(E/C) |
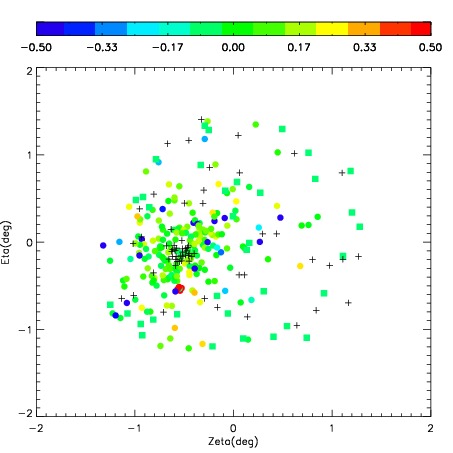
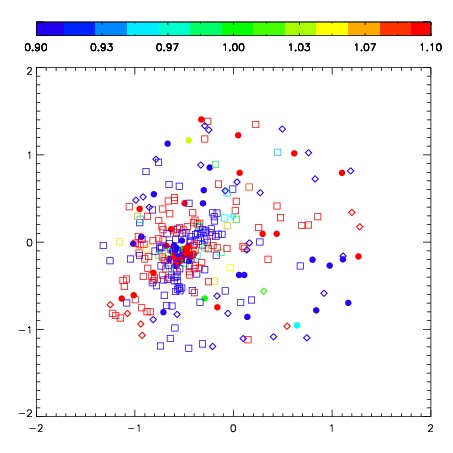
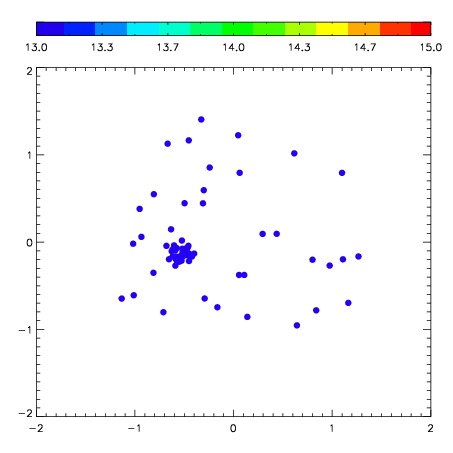
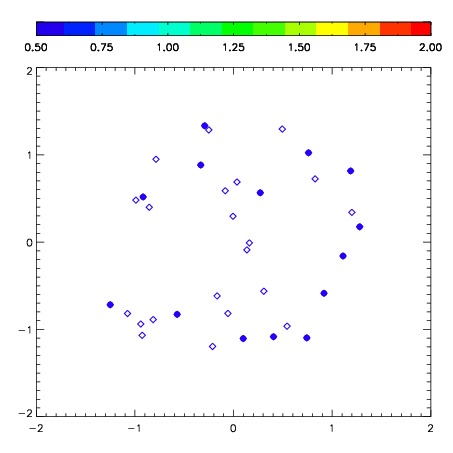
| Frame | Nreads | Zeropoints | Mag plots | Spatial mag deviation | Spatial sky 16325A emission deviations (filled: sky, open: star) | Spatial sky continuum emission | Spatial sky telluric CO2 absorption deviations (filled: H < 10) | |||||||||||||||||||||||
| 0 | 0 |
|
|
|
|
|
|
| IPAIR | NAME | SHIFT | NEWSHIFT | S/N | NAME | SHIFT | NEWSHIFT | S/N |
| 0 | 03190029 | 0.463095 | 0.00000 | 252.954 | 03190030 | -0.0124382 | 0.475533 | 260.691 |
| 1 | 03190025 | 0.456876 | 0.00621900 | 252.316 | 03190026 | -0.0179530 | 0.481048 | 250.451 |
| 2 | 03190024 | 0.457192 | 0.00590301 | 250.117 | 03190027 | -0.0157918 | 0.478887 | 249.403 |
| 3 | 03190028 | 0.461977 | 0.00111800 | 247.797 | 03190023 | 0.00000 | 0.463095 | 246.914 |