| Red | Green | Blue | |
| z | 17.64 | ||
| znorm | Inf | ||
| sky | -Inf | -Inf | -Inf |
| S/N | 29.4 | 49.9 | 54.8 |
| S/N(c) | 0.0 | 0.0 | 0.0 |
| SN(E/C) |

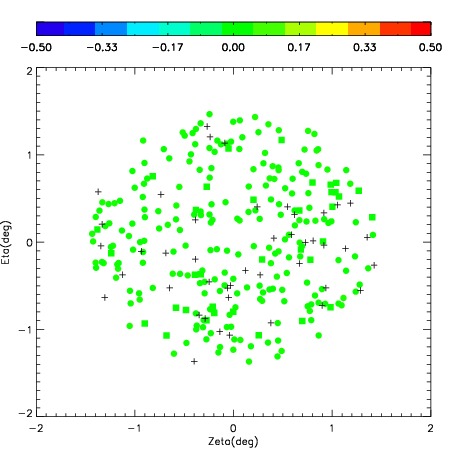
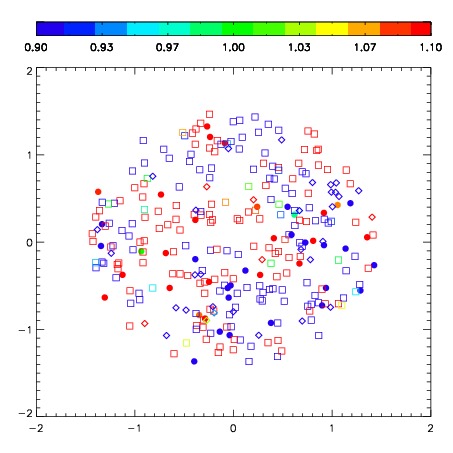
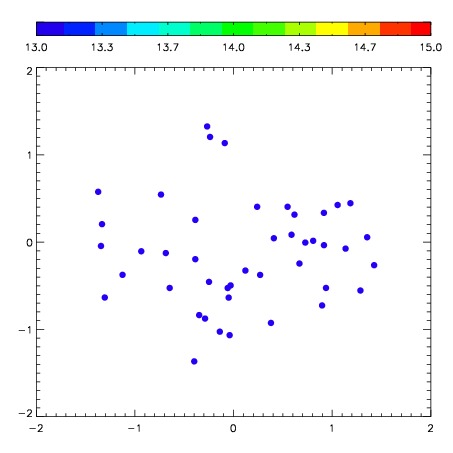
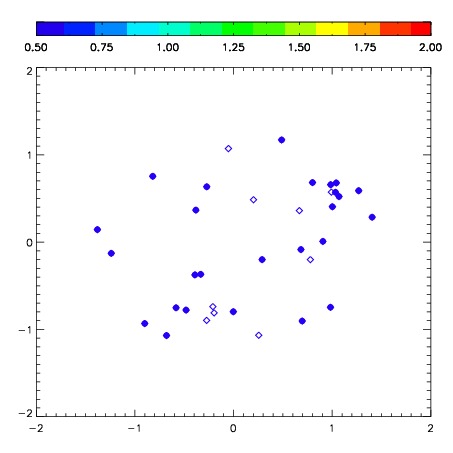
| Frame | Nreads | Zeropoints | Mag plots | Spatial mag deviation | Spatial sky 16325A emission deviations (filled: sky, open: star) | Spatial sky continuum emission | Spatial sky telluric CO2 absorption deviations (filled: H < 10) | |||||||||||||||||||||||
| 0 | 0 |
|
|
|
|
|
|
| IPAIR | NAME | SHIFT | NEWSHIFT | S/N | NAME | SHIFT | NEWSHIFT | S/N |
| 0 | 03410087 | 0.501509 | 0.00000 | 304.249 | 03410088 | 0.0320422 | 0.469467 | 299.958 |
| 1 | 03410083 | 0.493313 | 0.00819600 | 310.148 | 03410084 | 0.0334218 | 0.468087 | 314.368 |
| 2 | 03410082 | 0.489778 | 0.0117310 | 308.879 | 03410085 | 0.0336049 | 0.467904 | 314.157 |
| 3 | 03410086 | 0.491779 | 0.00973001 | 308.756 | 03410081 | 0.00000 | 0.501509 | 311.838 |