| Red | Green | Blue | |
| z | 17.66 | ||
| znorm | Inf | ||
| sky | -Inf | -Inf | -Inf |
| S/N | 4.8 | 9.3 | 10.2 |
| S/N(c) | 0.0 | 0.0 | 0.0 |
| SN(E/C) |

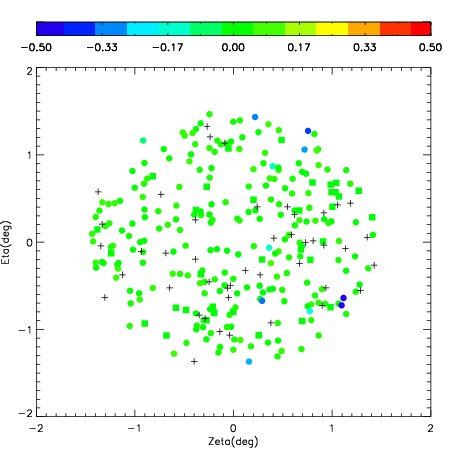

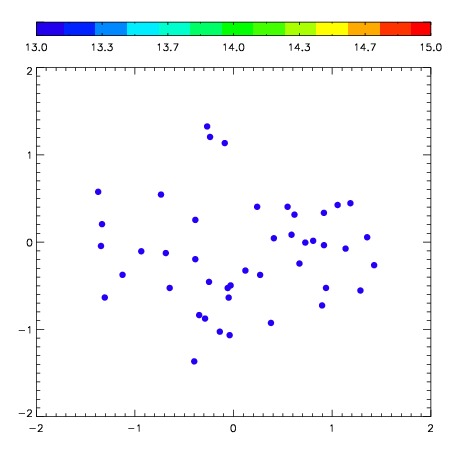

| Frame | Nreads | Zeropoints | Mag plots | Spatial mag deviation | Spatial sky 16325A emission deviations (filled: sky, open: star) | Spatial sky continuum emission | Spatial sky telluric CO2 absorption deviations (filled: H < 10) | |||||||||||||||||||||||
| 0 | 0 |
|
|
|
|
|
|
| IPAIR | NAME | SHIFT | NEWSHIFT | S/N | NAME | SHIFT | NEWSHIFT | S/N |
| 0 | 03500025 | 0.619100 | 0.00000 | 45.7606 | 03500031 | 0.0902189 | 0.528881 | 96.1941 |
| 1 | 03500030 | 0.603974 | 0.0151260 | 133.370 | 03500027 | 0.0825456 | 0.536554 | 136.988 |
| 2 | 03500029 | 0.600630 | 0.0184700 | 81.4763 | 03500028 | 0.0865026 | 0.532597 | 117.966 |
| 3 | 03500026 | 0.612786 | 0.00631398 | 49.3252 | 03500024 | 0.00000 | 0.619100 | 114.986 |