| Red | Green | Blue | |
| z | 17.64 | ||
| znorm | Inf | ||
| sky | -Inf | -Inf | -Inf |
| S/N | 28.5 | 47.7 | 53.1 |
| S/N(c) | 0.0 | 0.0 | 0.0 |
| SN(E/C) |

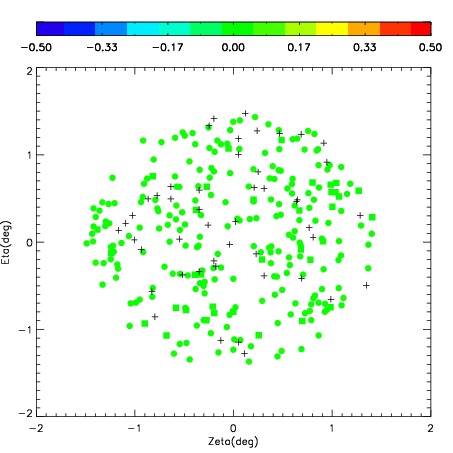
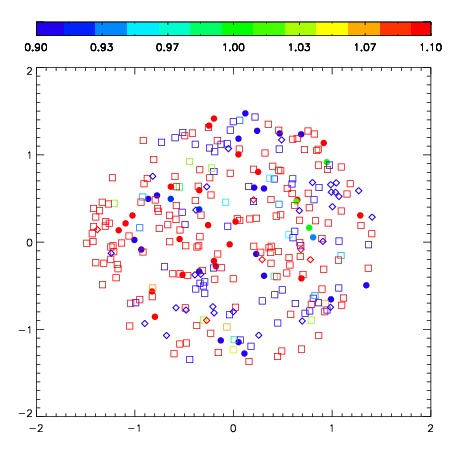

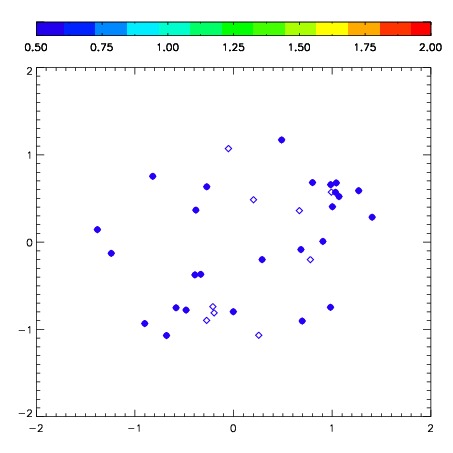
| Frame | Nreads | Zeropoints | Mag plots | Spatial mag deviation | Spatial sky 16325A emission deviations (filled: sky, open: star) | Spatial sky continuum emission | Spatial sky telluric CO2 absorption deviations (filled: H < 10) | |||||||||||||||||||||||
| 0 | 0 |
|
|
|
|
|
|
| IPAIR | NAME | SHIFT | NEWSHIFT | S/N | NAME | SHIFT | NEWSHIFT | S/N |
| 0 | 03200064 | 0.483938 | 0.00000 | 283.730 | 03200065 | 0.0147428 | 0.469195 | 281.127 |
| 1 | 03200059 | 0.469261 | 0.0146770 | 295.201 | 03200061 | 0.0154880 | 0.468450 | 292.665 |
| 2 | 03200060 | 0.481363 | 0.00257501 | 292.443 | 03200058 | 0.00000 | 0.483938 | 290.269 |
| 3 | 03200063 | 0.471511 | 0.0124270 | 287.263 | 03200062 | 0.0153859 | 0.468552 | 289.609 |