| Red | Green | Blue | |
| z | 17.64 | ||
| znorm | Inf | ||
| sky | -Inf | -Inf | -Inf |
| S/N | 22.5 | 41.3 | 44.9 |
| S/N(c) | 0.0 | 0.0 | 0.0 |
| SN(E/C) |
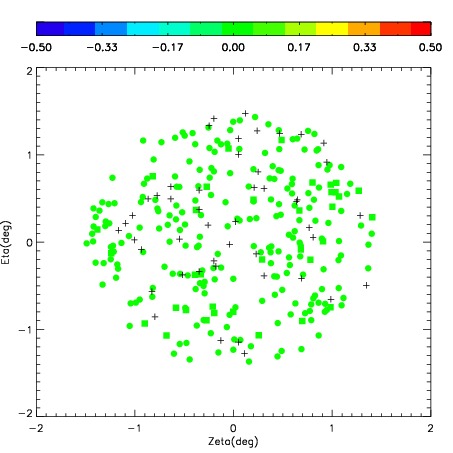
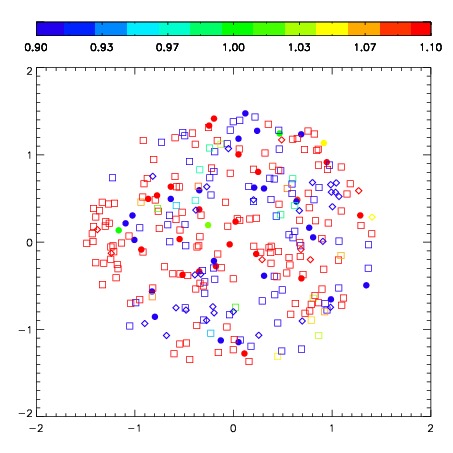

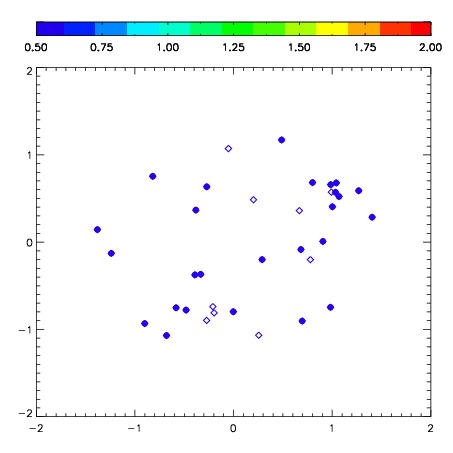
| Frame | Nreads | Zeropoints | Mag plots | Spatial mag deviation | Spatial sky 16325A emission deviations (filled: sky, open: star) | Spatial sky continuum emission | Spatial sky telluric CO2 absorption deviations (filled: H < 10) | |||||||||||||||||||||||
| 0 | 0 |
|
|
|
|
|
|
| IPAIR | NAME | SHIFT | NEWSHIFT | S/N | NAME | SHIFT | NEWSHIFT | S/N |
| 0 | 03780026 | 0.476256 | 0.00000 | 261.083 | 03780025 | 0.00000 | 0.476256 | 254.590 |
| 1 | 03780027 | 0.471990 | 0.00426602 | 261.839 | 03780028 | 0.0211779 | 0.455078 | 258.898 |
| 2 | 03780031 | 0.471260 | 0.00499600 | 260.584 | 03780032 | 0.0232215 | 0.453035 | 253.209 |
| 3 | 03780030 | 0.470625 | 0.00563100 | 256.795 | 03780029 | 0.0207665 | 0.455490 | 239.264 |