| Red | Green | Blue | |
| z | 17.64 | ||
| znorm | Inf | ||
| sky | -Inf | -Inf | -Inf |
| S/N | 27.8 | 47.5 | 52.4 |
| S/N(c) | 0.0 | 0.0 | 0.0 |
| SN(E/C) |

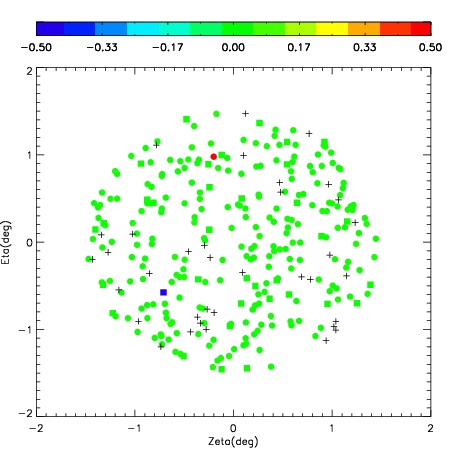
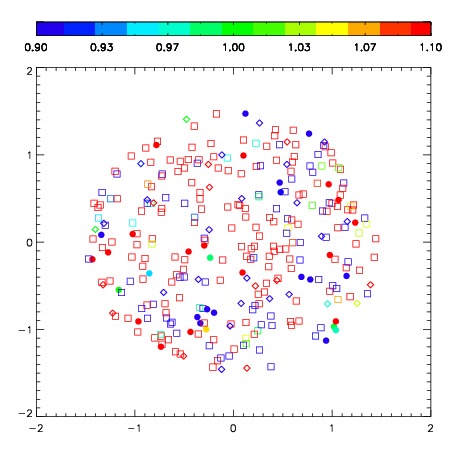
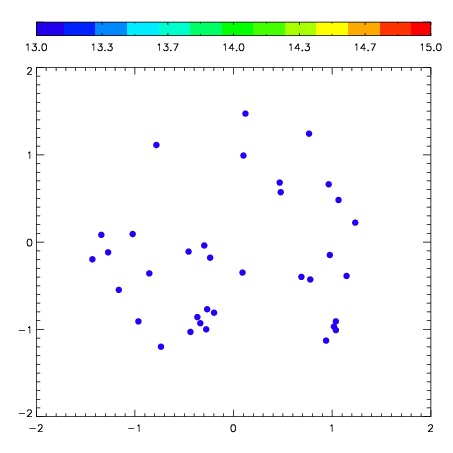
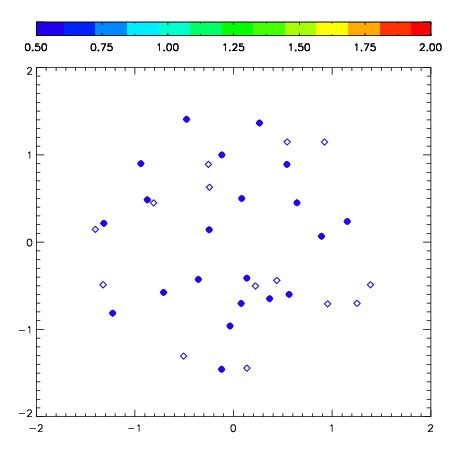
| Frame | Nreads | Zeropoints | Mag plots | Spatial mag deviation | Spatial sky 16325A emission deviations (filled: sky, open: star) | Spatial sky continuum emission | Spatial sky telluric CO2 absorption deviations (filled: H < 10) | |||||||||||||||||||||||
| 0 | 0 |
|
|
|
|
|
|
| IPAIR | NAME | SHIFT | NEWSHIFT | S/N | NAME | SHIFT | NEWSHIFT | S/N |
| 0 | 03190073 | 0.485719 | 0.00000 | 270.449 | 03190074 | 0.0306419 | 0.455077 | 269.641 |
| 1 | 03190069 | 0.482403 | 0.00331599 | 282.498 | 03190067 | 0.00000 | 0.485719 | 278.155 |
| 2 | 03190068 | 0.485616 | 0.000102997 | 282.094 | 03190070 | 0.0298670 | 0.455852 | 271.374 |
| 3 | 03190072 | 0.477844 | 0.00787500 | 274.281 | 03190071 | 0.0293564 | 0.456363 | 270.232 |