| Red | Green | Blue | |
| z | 17.64 | ||
| znorm | Inf | ||
| sky | -Inf | -Inf | -Inf |
| S/N | 25.5 | 45.0 | 53.4 |
| S/N(c) | 0.0 | 0.0 | 0.0 |
| SN(E/C) |

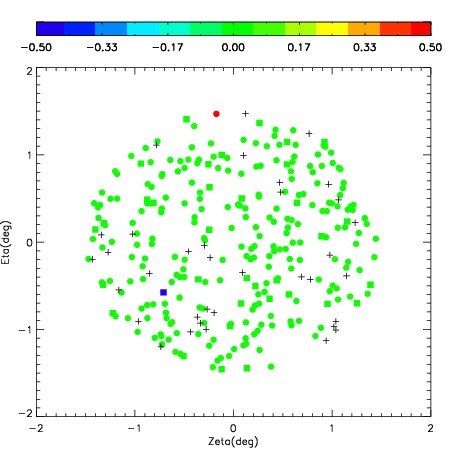
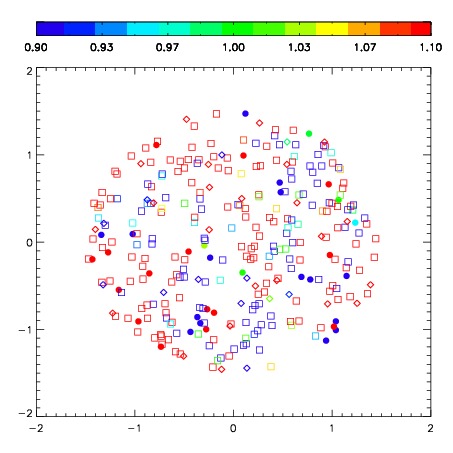

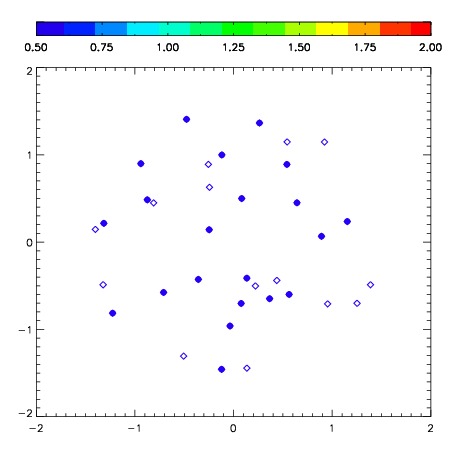
| Frame | Nreads | Zeropoints | Mag plots | Spatial mag deviation | Spatial sky 16325A emission deviations (filled: sky, open: star) | Spatial sky continuum emission | Spatial sky telluric CO2 absorption deviations (filled: H < 10) | |||||||||||||||||||||||
| 0 | 0 |
|
|
|
|
|
|
| IPAIR | NAME | SHIFT | NEWSHIFT | S/N | NAME | SHIFT | NEWSHIFT | S/N |
| 0 | 03400042 | 0.558353 | 0.00000 | 262.326 | 03400043 | 0.0690705 | 0.489282 | 259.002 |
| 1 | 03400037 | 0.534187 | 0.0241660 | 271.301 | 03400036 | 0.00000 | 0.558353 | 266.339 |
| 2 | 03400041 | 0.553532 | 0.00482100 | 267.270 | 03400040 | 0.0498240 | 0.508529 | 265.114 |
| 3 | 03400038 | 0.533956 | 0.0243970 | 256.306 | 03400039 | 0.0488182 | 0.509535 | 249.218 |