| Frame | Nreads | Zeropoints | Mag plots
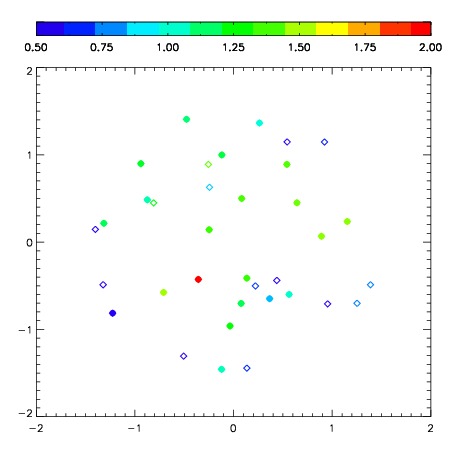
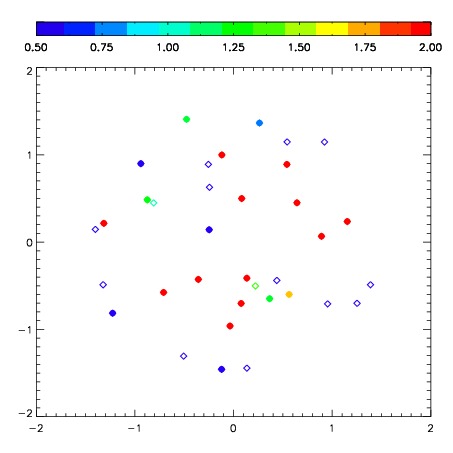
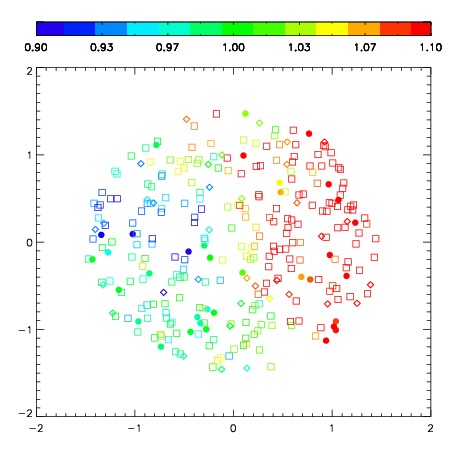
| Spatial mag deviation
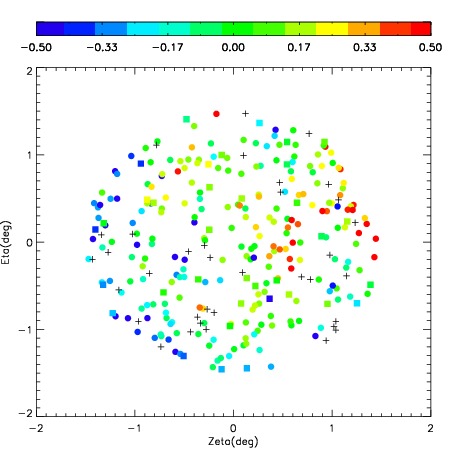
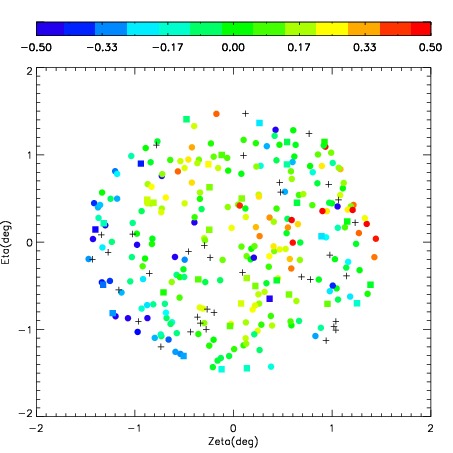
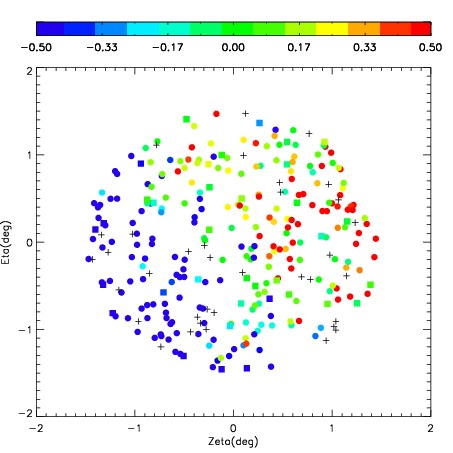
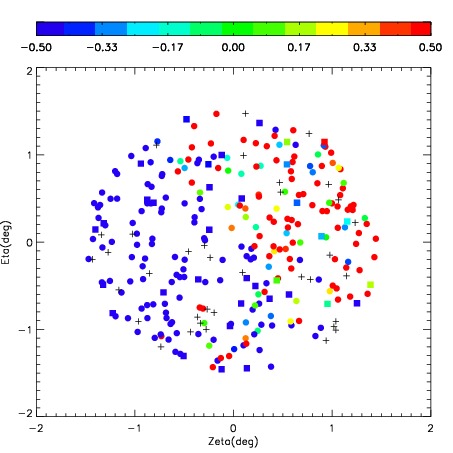
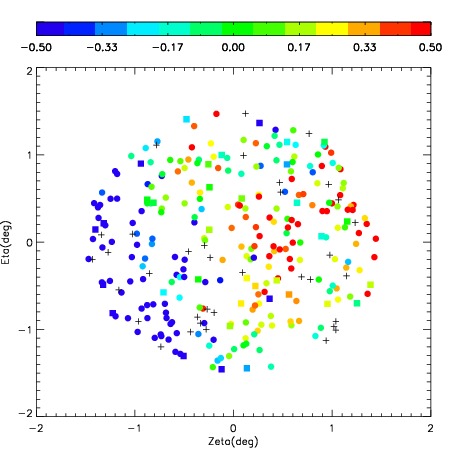
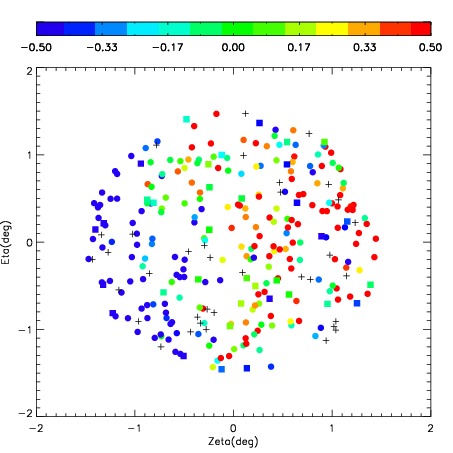
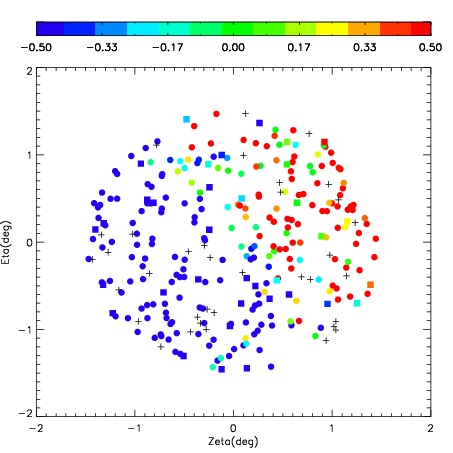
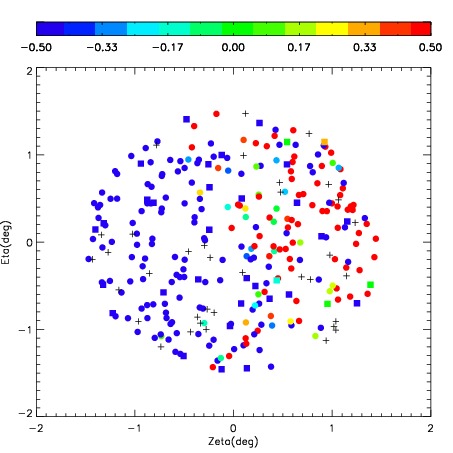
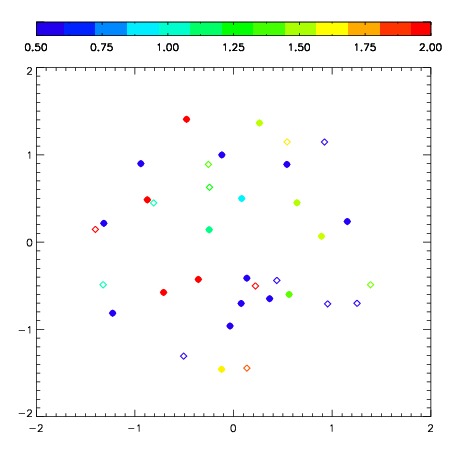
| Spatial sky 16325A emission deviations (filled: sky, open: star)
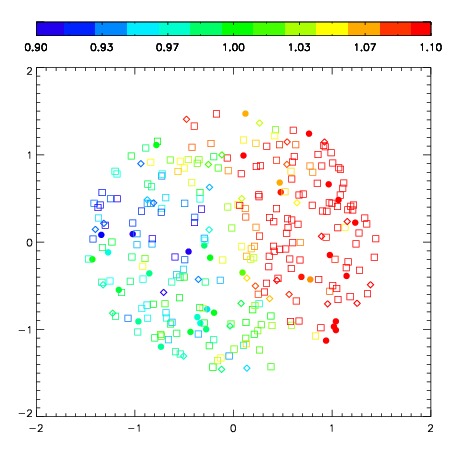
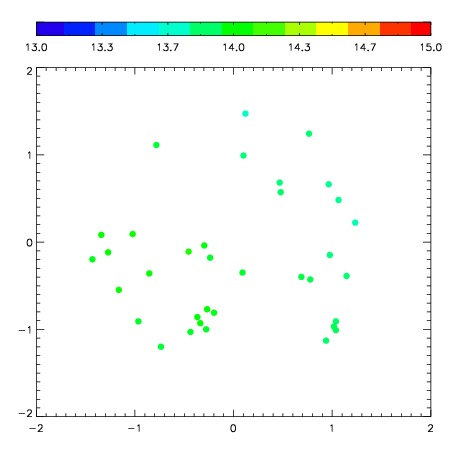
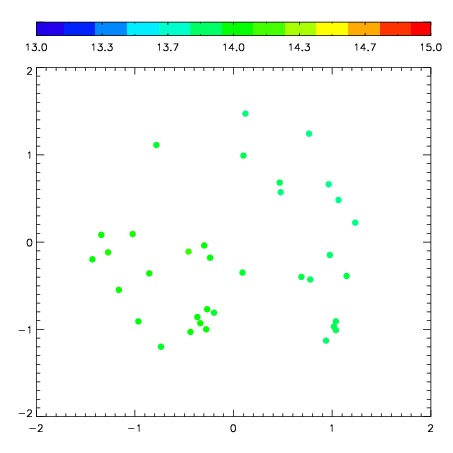
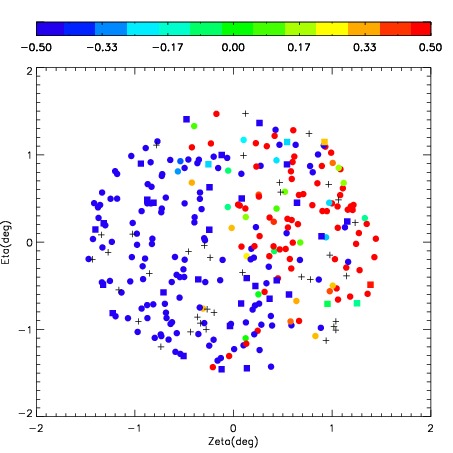
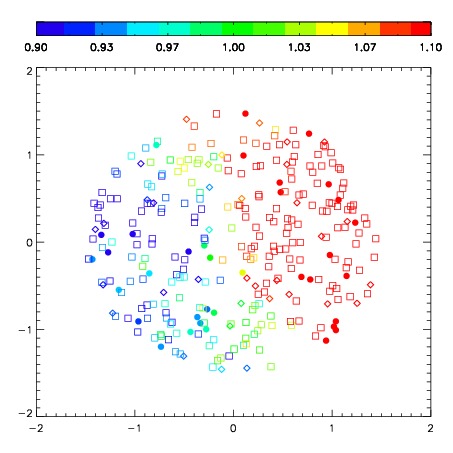
| Spatial sky continuum emission
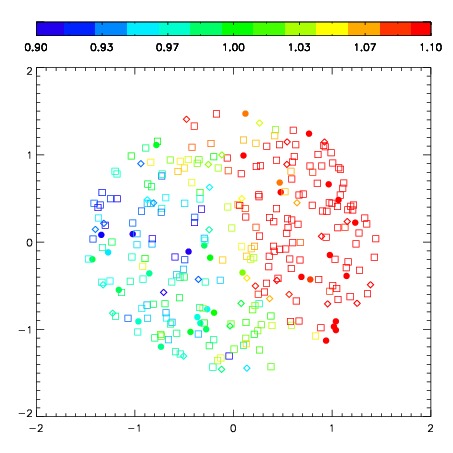
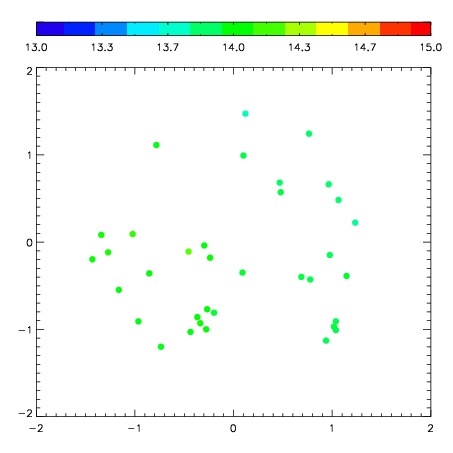
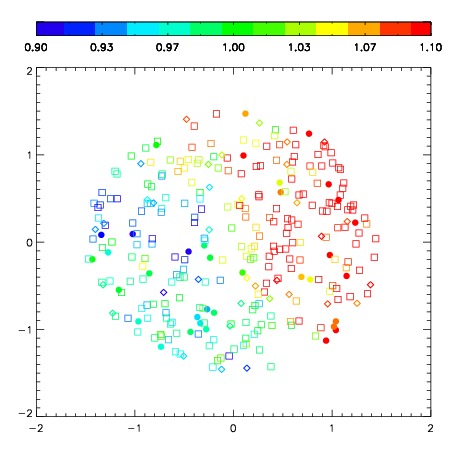
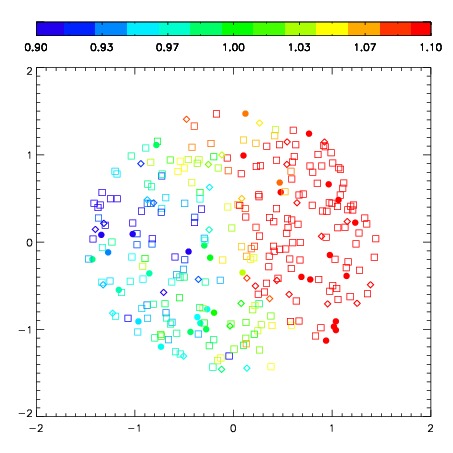
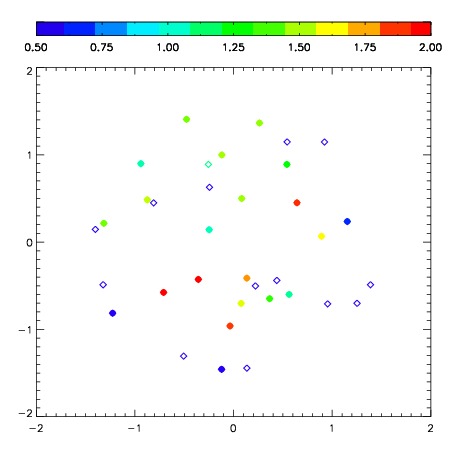
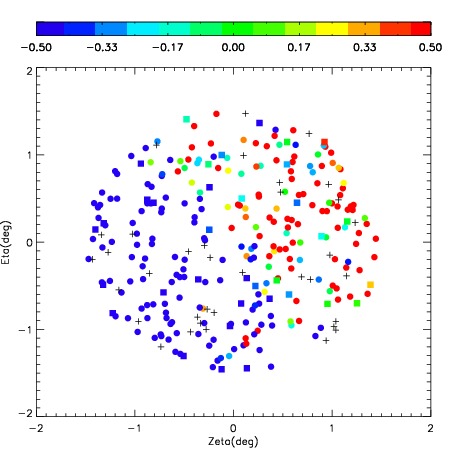
| Spatial sky telluric CO2 absorption deviations (filled: H < 10)
|
| 3500040
| 47
| | Red | Green | Blue
| | z | | 16.59
| | znorm | | 12.41
| | sky | 14.1 | 14.0 | 13.9
| | S/N | 2.6 | 5.1 | 7.1
| | S/N(c) | 2.2 | 4.2 | 6.8
| | SN(E/C) 1.09
|
| 
| 
| 
| 
| 
|
| 3500041
| 47
| | Red | Green | Blue
| | z | | 17.02
| | znorm | | 12.84
| | sky | 14.2 | 14.0 | 14.1
| | S/N | 3.6 | 6.7 | 8.6
| | S/N(c) | 2.9 | 5.7 | 8.0
| | SN(E/C) 1.01
|
| 
| 
| 
| 
| 
|
| 3500042
| 47
| | Red | Green | Blue
| | z | | 16.54
| | znorm | | 12.36
| | sky | 14.0 | 13.9 | 14.0
| | S/N | 2.4 | 4.7 | 6.4
| | S/N(c) | 2.0 | 3.9 | 6.1
| | SN(E/C) 1.08
|
| 
| 
| 
| 
| 
|
| 3500043
| 47
| | Red | Green | Blue
| | z | | 15.37
| | znorm | | 11.19
| | sky | 13.9 | 13.8 | 14.1
| | S/N | 1.0 | 1.9 | 4.0
| | S/N(c) | 0.8 | 1.3 | 4.0
| | SN(E/C) 1.06
|
| 
| 
| 
| 
| 
|
| 3500044
| 47
| | Red | Green | Blue
| | z | | 13.94
| | znorm | | 9.76
| | sky | 13.9 | 14.0 | 14.2
| | S/N | 0.2 | 0.7 | 2.6
| | S/N(c) | 0.0 | 0.0 | 0.0
| | SN(E/C) 3.27
|
| 
| 
| 
| 
| 
|
| 3500045
| 47
| | Red | Green | Blue
| | z | | 15.80
| | znorm | | 11.62
| | sky | 14.0 | 13.9 | 14.0
| | S/N | 1.6 | 3.2 | 4.9
| | S/N(c) | 1.3 | 2.4 | 4.6
| | SN(E/C) 1.07
|
| 
| 
| 
| 
| 
|
| 3500046
| 47
| | Red | Green | Blue
| | z | | 15.13
| | znorm | | 10.95
| | sky | 13.8 | 13.8 | 13.9
| | S/N | 0.9 | 1.9 | 3.7
| | S/N(c) | 0.0 | 0.0 | 0.0
| | SN(E/C) 1.24
|
| 
| 
| 
| 
| 
|
| 3500047
| 47
| | Red | Green | Blue
| | z | | 14.22
| | znorm | | 10.04
| | sky | 13.8 | 13.8 | 14.0
| | S/N | 0.4 | 0.9 | 2.6
| | S/N(c) | 0.0 | 0.0 | 0.0
| | SN(E/C) 1.68
|
| 
| 
| 
| 
| 
|
| 3500048
| 47
| | Red | Green | Blue
| | z | | 15.50
| | znorm | | 11.32
| | sky | 14.0 | 13.9 | 14.0
| | S/N | 0.9 | 2.3 | 3.8
| | S/N(c) | 0.8 | 1.7 | 3.7
| | SN(E/C) 1.04
|
| 
| 
| 
| 
| 
|
| 3500049
| 47
| | Red | Green | Blue
| | z | | 14.53
| | znorm | | 10.35
| | sky | 13.8 | 13.8 | 13.9
| | S/N | 0.4 | 0.9 | 2.1
| | S/N(c) | 0.5 | 0.6 | 2.2
| | SN(E/C) 1.03
|
| 
| 
| 
| 
| 
|
| 3500050
| 47
| | Red | Green | Blue
| | z | | 13.66
| | znorm | | 9.48
| | sky | 13.8 | 13.9 | 14.1
| | S/N | 0.2 | 0.6 | 2.2
| | S/N(c) | 0.0 | 0.0 | 0.0
| | SN(E/C) 3.96
|
| 
| 
| 
| 
| 
|
| 3500051
| 47
| | Red | Green | Blue
| | z | | 13.85
| | znorm | | 9.67
| | sky | 14.0 | 14.1 | 14.4
| | S/N | 0.5 | 0.9 | 2.4
| | S/N(c) | 0.0 | 0.0 | 0.0
| | SN(E/C) 3.86
|
| 
| 
| 
| 
| 
|