| Red | Green | Blue | |
| z | 17.65 | ||
| znorm | Inf | ||
| sky | -Inf | -Inf | -Inf |
| S/N | 3.1 | 5.7 | 9.7 |
| S/N(c) | 0.0 | 0.0 | 0.0 |
| SN(E/C) |

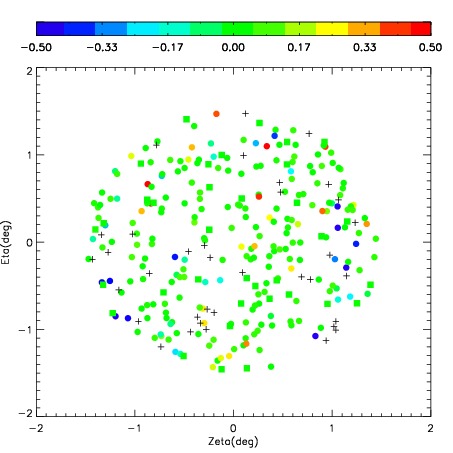
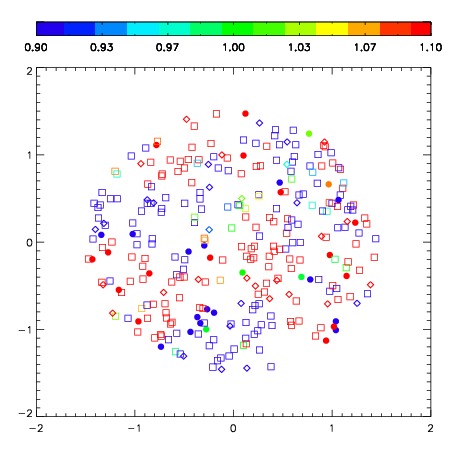
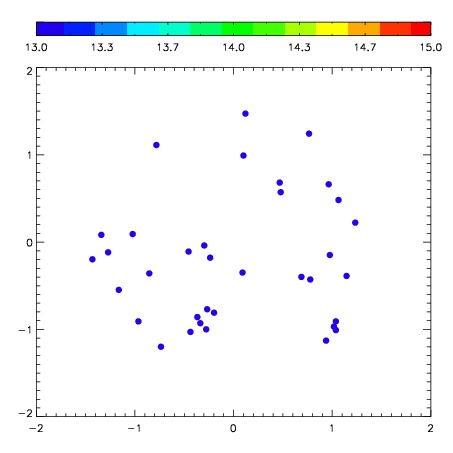
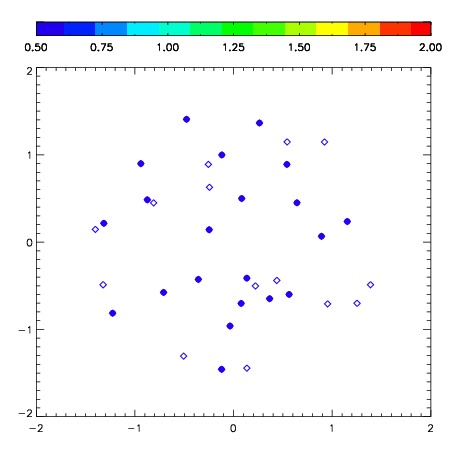
| Frame | Nreads | Zeropoints | Mag plots | Spatial mag deviation | Spatial sky 16325A emission deviations (filled: sky, open: star) | Spatial sky continuum emission | Spatial sky telluric CO2 absorption deviations (filled: H < 10) | |||||||||||||||||||||||
| 0 | 0 |
|
|
|
|
|
|
| IPAIR | NAME | SHIFT | NEWSHIFT | S/N | NAME | SHIFT | NEWSHIFT | S/N |
| 0 | 03500042 | 0.523725 | 0.00000 | 87.9979 | 03500048 | 0.0270419 | 0.496683 | 39.0130 |
| 1 | 03500041 | 0.512856 | 0.0108690 | 116.433 | 03500040 | 0.00000 | 0.523725 | 94.1122 |
| 2 | 03500045 | 0.514039 | 0.00968599 | 51.6865 | 03500043 | 0.0229636 | 0.500761 | 36.1297 |