| Red | Green | Blue | |
| z | 17.64 | ||
| znorm | Inf | ||
| sky | -NaN | -NaN | -Inf |
| S/N | 30.9 | 52.5 | 58.1 |
| S/N(c) | 0.0 | 0.0 | 0.0 |
| SN(E/C) |


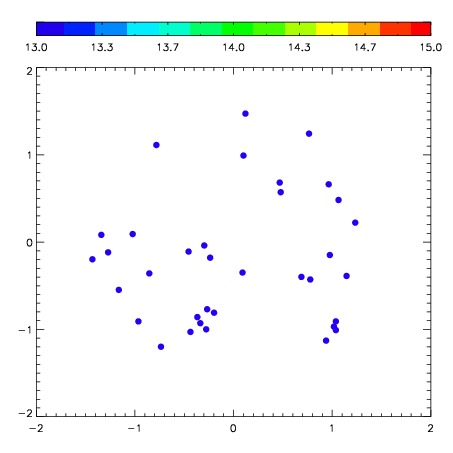

| Frame | Nreads | Zeropoints | Mag plots | Spatial mag deviation | Spatial sky 16325A emission deviations (filled: sky, open: star) | Spatial sky continuum emission | Spatial sky telluric CO2 absorption deviations (filled: H < 10) | |||||||||||||||||||||||
| 0 | 0 |
|
|
|
|
|
|
| IPAIR | NAME | SHIFT | NEWSHIFT | S/N | NAME | SHIFT | NEWSHIFT | S/N |
| 0 | 03660052 | 0.429717 | 0.00000 | 305.570 | 03660050 | 0.00000 | 0.429717 | 314.079 |
| 1 | 03660055 | 0.418844 | 0.0108730 | 324.958 | 03660057 | -0.00485724 | 0.434574 | 326.110 |
| 2 | 03660056 | 0.424263 | 0.00545400 | 324.309 | 03660053 | 0.00241500 | 0.427302 | 314.152 |
| 3 | 03660051 | 0.424085 | 0.00563201 | 303.316 | 03660054 | 7.29859e-05 | 0.429644 | 309.074 |