| Red | Green | Blue | |
| z | 17.64 | ||
| znorm | Inf | ||
| sky | -Inf | -Inf | -Inf |
| S/N | 17.5 | 32.5 | 39.7 |
| S/N(c) | 0.0 | 0.0 | 0.0 |
| SN(E/C) |

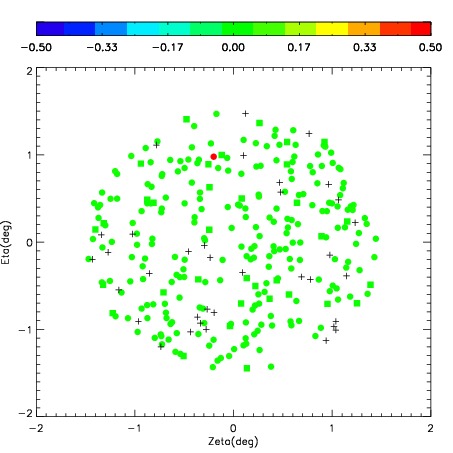
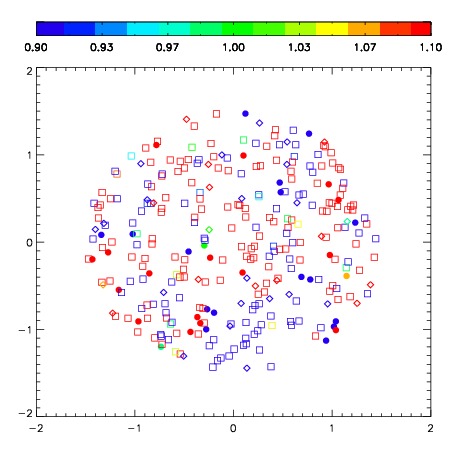
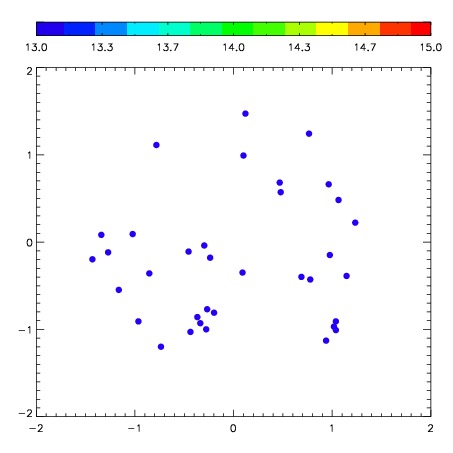

| Frame | Nreads | Zeropoints | Mag plots | Spatial mag deviation | Spatial sky 16325A emission deviations (filled: sky, open: star) | Spatial sky continuum emission | Spatial sky telluric CO2 absorption deviations (filled: H < 10) | |||||||||||||||||||||||
| 0 | 0 |
|
|
|
|
|
|
| IPAIR | NAME | SHIFT | NEWSHIFT | S/N | NAME | SHIFT | NEWSHIFT | S/N |
| 0 | 03760057 | 0.470886 | 0.00000 | 201.412 | 03760054 | 0.00884888 | 0.462037 | 218.317 |
| 1 | 03760052 | 0.459483 | 0.0114030 | 220.273 | 03760055 | 0.00714269 | 0.463743 | 246.201 |
| 2 | 03760056 | 0.465241 | 0.00564501 | 217.770 | 03760058 | 0.00532272 | 0.465563 | 236.191 |
| 3 | 03760053 | 0.468258 | 0.00262800 | 203.983 | 03760051 | 0.00000 | 0.470886 | 218.567 |